Electrophoresis is a powerful method that was developed long before molecular biology came into existence. The principle behind electrophoresis is that charged molecules will migrate toward the opposite pole and separate from each other based on physical characteristics. For example, SDS-PAGE separates proteins according to their molecular weights. The two limiting factors of traditional electrophoresis were: 1) detection of molecules upon completion of electrophoretic separation and 2) only low voltages could be used to prevent heat damage of the samples.
Capillary electrophoresis solved both of these problems. Because the capillary tube has a high surface to volume ratio (25-100 µm diameter), it radiates heat readily and thus samples do not over heat. Detection of the migrating molecules is accomplished by shining a light source through a portion of the tubing and detecting the light emitted from the other side (figure 1).
Figure 1. Schematic of capillary electrophoresis system. Samples enter the tube from the right and travel to the left to the detection system which records the chromatogram output on a computer.
Sample run times are very short thanks to the high voltage (10 - 30 kV). The capillary tubes can be filled with many different matrices depending on the sample type. Samples are applied to the capillary tubes when the cathode buffer is moved aside and sample chamber placed at the opening of the capillary tube. Either pressure is applied to the sample and 10 - 100 nL is injected or an electrical current is applied through the sample and only the charged molecules enter the capillary. Once the electrophoretic separation is completed, the contents of the capillary are flushed out and fresh matrix fills the tube. Replacing the matrix within the capillary minimizes the possiblity of contaminating samples between runs.
Below are four images taken of a Megabase DNA sequencer and microsatellite genotyper.
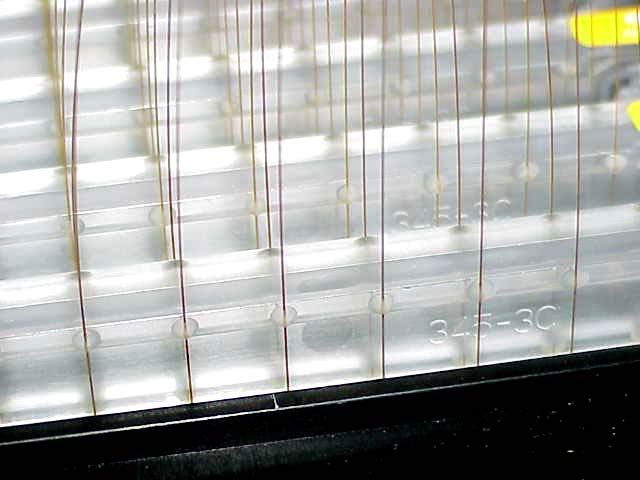
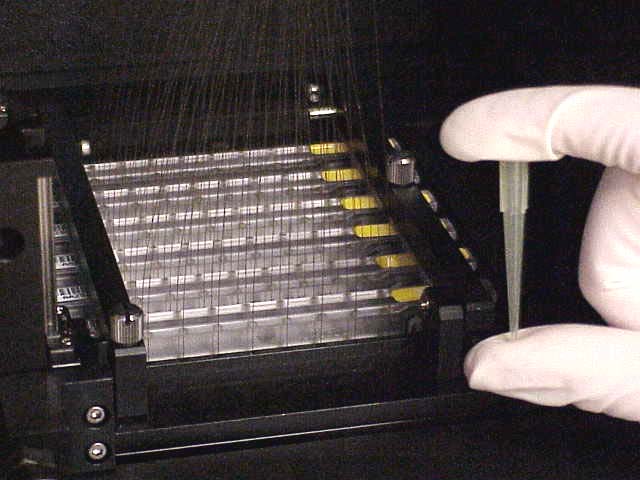
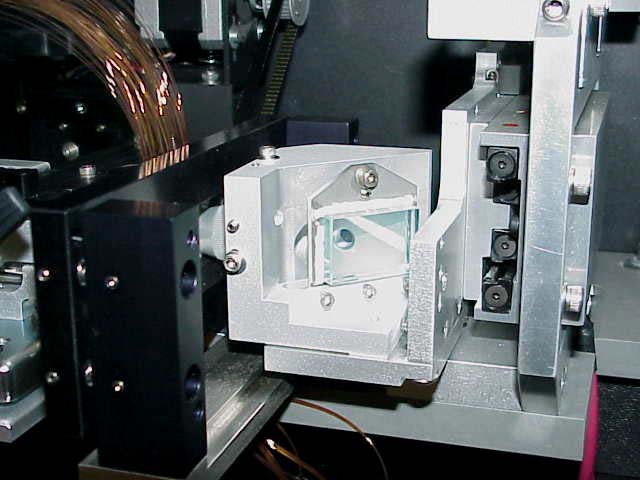
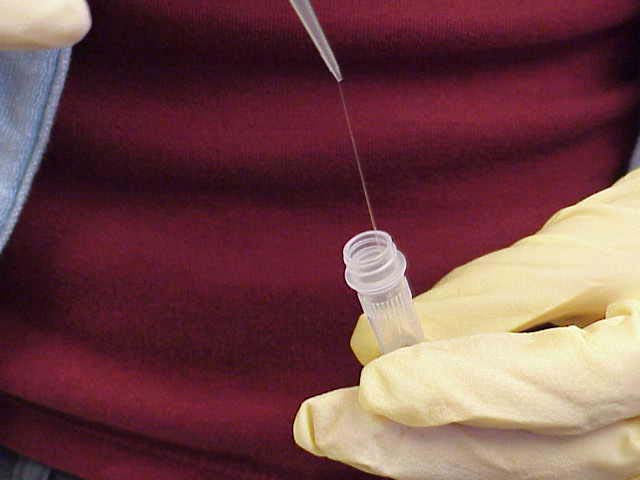
Figure 2. Megabase DNA sequencer images. Clockwise from top left: close up of capillary tubes descending into a 96-well plate containing samples; yellow tip shown with all 96 capillary tubes for size comparison. From bottom left: optical detection system that shines focues light into the tubes and detects the amount and color of the emitted light; gooey matrix (stretching between a yellow tip and the vial) that fills the capillary tubes after each run.
![]()
![]()
© Copyright 2002 Department of Biology, Davidson College, Davidson, NC 28036
Send comments, questions, and suggestions to: macampbell@davidson.edu