My Favorite Yeast Expression:
TOP1 and
YOL008W
In a previous assignment, I used online genomic databases to investigate and characterize the two Saccharomyces cerevisiae genes, TOP1 (YOL006C) and YOL008W, primarily by sequence analysis. TOP1 encodes Topoisomerase 1, an enzyme that cleaves single stranded DNA. Top1 plays a role in cellular functions such as mitotic recombination, DNA elongation, chromatic assembly/disassembly, transcription regulation, and mitotic chromosome condensation. The yeast gene YOL008W is non-annotated, meaning very little is known about its function. From sequence analysis, I hypothesized that the protein encoded by YOL008W functions in the cytoplasm or nucleus and has a role in lipid metabolism or polyketide synthesis. Both TOP1 and YOL008W are located on the S. cerevisiae chromosome XV.
To view my web page on the characterization of these two genes, go to My Favorite Yeast Genes: TOP1 and YOL008W.
In this web page I will attempt to characterize the expression patterns of TOP1 and YOL008W using online genomic databases. The main focus of this page will be centered on DNA microarrays. DNA microarrays are glass slides with many different tiny “spots” of gene sequences. The genes in an organism are amplified by PCR and spotted onto the slide so that each spot is a different gene. Then, mRNA is extracted from the organism of interest under two different conditions (ie. yeast cells grown in the presence and absence of oxygen). cDNA is made from the mRNA, and each population of cDNA is given a different color of either red of green, depending on which condition it came from. The cDNAs are incubated on the DNA chip so that they can form complimentary base pairs with the DNA, and the excess is washed off. A scanner is used to detect to which genes the cDNA has bound. A red or green signal indicates under which environmental condition the gene shows activity. The data is often converted to a color scale, where red corresponds to gene induction, green corresponds to gene repression, and black represents no change in gene expression between the control and experimental conditions (Campbell and Heyer, 2003).
Click here to see an animation of a DNA microarray.
Microarrays allow the investigator to simultaneously detect the levels of expression of many different genes during certain conditions. Genes can be clustered by the similarities of their expression levels (termed "guilt by association"). The function of an unknown gene can be hypothesized by determining to which genes it shows similar expression levels (Campbell and Heyer, 2003).
I used the database Expression Connection to find many of the DNA microarrays on this page. The color scale used for each microarray from expression connection is shown below (Figure 1). I also used Function Junction to search for information on the expression patterns Both of these databases are part of SGD, a database that contains information on the yeast genome.
![]()
Figure 1. Color scale for expression levels of a gene determined by DNA microarrays. The brighter the intensity of green indicates the greater level of gene repression and the brighter the intensity of red indicates the greater level of gene induction. Black indicates no change in the experimental expression levels of the gene when compared to the control (Image from Expression Connection; SGD, 2003.)
TOP1
I will use DNA microarrays to examine the expression levels of TOP1 under certain environmental conditions. I hope to find data that is consistent with the known function of TOP1; it is also possible that I will find data that suggests an additional function for TOP1 then the already known functions.
Evolution of expression during glucose limitation (Ferea T.L., 1999). Click here to view the full text publication.
During this experiment, a clonal population of cells was grown on a glucose-limited medium for more than 250 generations. The authors hypothesized that populations that best adapted to the stringent conditions would show a better survival rate over the populations that did not evolve. Three evolved strains were found; some of the genes showed altered expression patterns from glucose limitation when compared to the parental strain, while other genes showed similar expression patterns. Many of the altered genes were involved in glycolysis, the tricarboxylic acid cycle, oxidative phosphorylation, and metabolic transport (Ferea et al., 1999). The data from the microarray show that TOP1 was repressed in the second evolved population when compared to the parental strain (Figure 2). There does not appear to be any significant change in expression levels for TOP1 in the first or third evolved strain. Figure 2 also shows 20 genes with the most similar expression patterns to TOP1 under this environmental condition. Some of the genes with similar expression patterns are involved in metabolism, growth, fusion, protein biosynthesis, replication, and the cell cycle. I would expect TOP1 to have similar expression levels to genes involved in some of these functions because it plays a role in processes such as replication and transcription. It is interesting to note that the expression level of TOP1 was only changed in one of the three new cell populations. I would have expected the expression levels of TOP1 to change in all populations because it is involved in some fundamental processes of the cell cycle, and I would have predicted the cell cycle to be altered with glucose limitation.
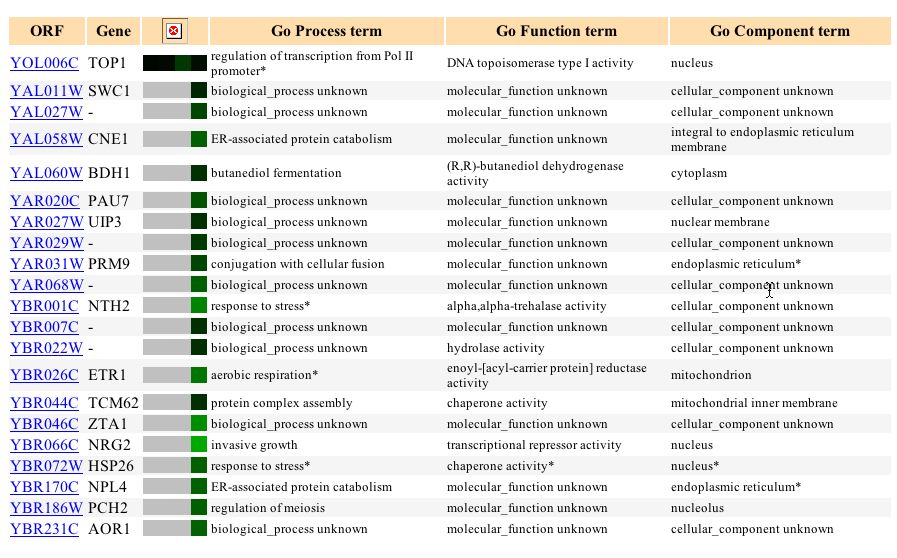
Figure 2. Expression of TOP1 in evolved populations during glucose limitation and 20 genes with similar expression levels to TOP1. The first column of boxes represents the parental strain of yeast. The second, third, and fourth rows are the three different evolved populations. (Image from Expression Connection; SGD, 2003. Click here to view image.)
Expression during sporulation (Chu S., 1998). Click here to view abstract for the publication.
In this experiment, the expression of genes were examined during sporulation, the process by which diploid budding yeast cells produce haploid cells (Chu, 1998). From the microarry, the expression of TOP1 does not appear to differ until 2 hours, when it becomes induced, and then decreases expression levels after that. The graph below (Figure 3) illustrates the sharp induction between 0 and 2 hours and the decrease in expression after that (it is repressed at about 9 hours). Its maximum induction was 1.6. The genes with the most similar expression patterns to TOP1 during sporulation were involved in catabolism, DNA replication initiation and protein biosynthesis. Other genes with similar expression patterns did not have a known function (Figure 4). CTF18, the gene with the most similar expression pattern to TOP1, is involved in sister chromatid cohesion and DNA damage checkpoint. CUE1, the gene with the second most similar expression, is involved in protein binding, protein catabolism, and protein localization. It is interesting that TOP1 shares similar expression patterns to these genes, because it is involved in DNA replication (occurs before the DNA damage checkpoint), mitotic recombination (sister chromatid cohesion also occurs during mitotsis) and transcription (precedes protein synthesis). It appears that during sporulation, TOP1 is expressed similarly to genes with functions related to its own.
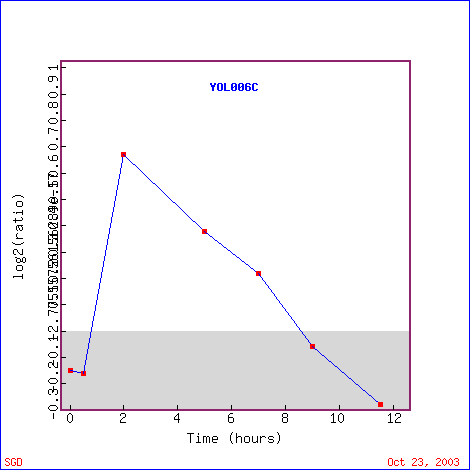
Figure 3. Expression levels of TOP1 during sporulation. TOP1 is induced until 2 hours after which the levels decrease and it is repressed. (Image from Expression Connection; SGD, 2003. Click here to view image.)
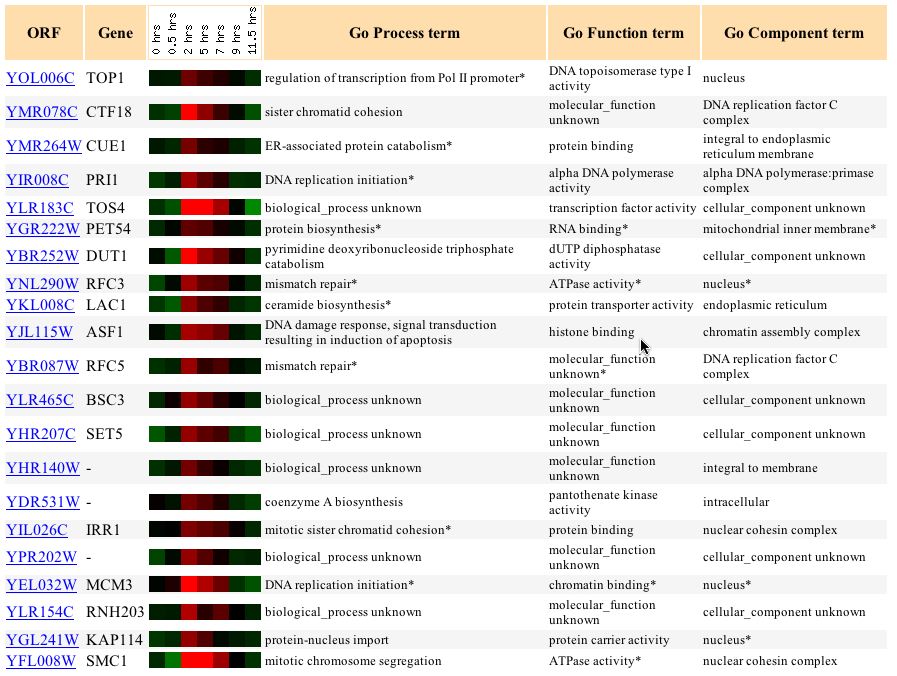
Figure 4. Genes with similar expression patterns to TOP1 during sporulation. (Image from Expression Connection; SGD, 2003. Click here to view image.)
Expression during the diauxic shift (DeRisi, J.L., 1997). Click here to view the abstract for the publication.
The diauxic shift refers to the conversion of yeast cells from fermentation to respiration. The epxression patterns of the genes over time during the diauxic shift indicates their role during this metabolic change (DeRisi et al., 1997). Interestingly, TOP1 initially showed no change in expression levels, but then gradually was repressed over time. The maximum repression was -1.9. The graph illustrates its constant levels of expression until approximately 10 hours, when it is then slightly induced but decreases after that until 20 hours (Figure 5). The genes with similar expression levels that are clustered with TOP1 all show a slight induction around 11.5 hours, and then are repressed after that. The strongest levels of repression are at 20 hours (Figure 6). Genes with similar expression function in processes such as metabolism, RNA processing, translation termination and biosynthesis. FCY21 (the third gene listed in Figure 6) has cytosine-purine permease activity, so its activity deals with DNA, just as TOP1 does. FUR1 is involved in the pyrimidine salvage pathway, so its activity would also involve DNA. From these data, it does not seem that enzymes that have functions with DNA are involved as the cells shifts from fermentation to respiration. TOP1 is not known to play a role in either fermentation or respiration, so it makes sense that it is repressed (these data are consistent with its known functions).
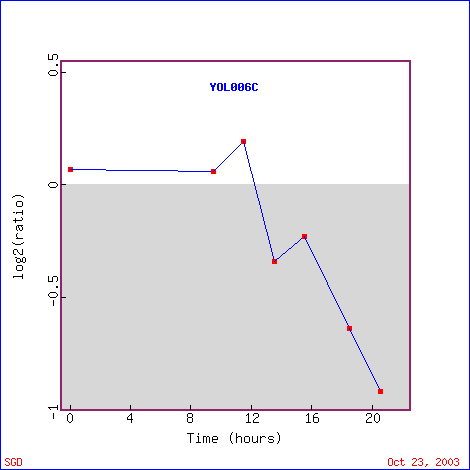
Figure 5. TOP1 is repressed during the diauxic shift. (Image from Expression Connection; SGD, 2003. Click here to view the image.)
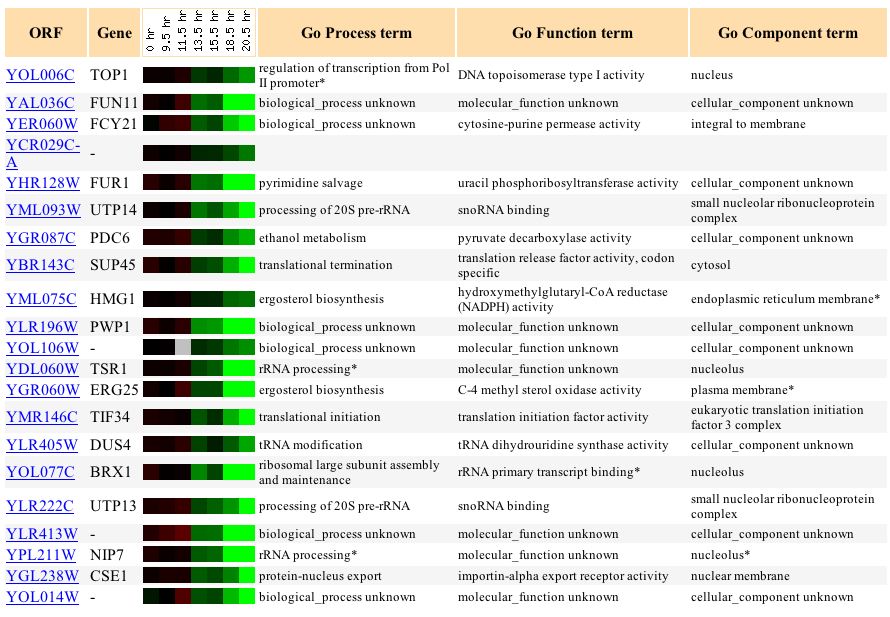
Figure 6. Genes with similar expression patterns to TOP1
during the diauxic shift. (Image from Expression
Connection; SGD, 2003. Click here
to view the image.)
Expression in response to histone depletion (Wyrick, J.J., 1999) Click here to view the publication.
A nucleosome is the structure of DNA coiled around histone proteins. Histone proteins facilitate chromosomal condensation by having the DNA wrapped around the proteins. It is thought that nucleosome structures may silence certain genes by having the DNA coiled around proteins. Wyrick et al. hypothesized that depleting histone proteins would cause an increase in expression levels of genes, since the DNA would no longer be wrapped around the histone proteins. They found that histone depletion of H4 causes 15% of the genes to be induced and 10% of the genes to be repressed, while 75% showed no change in expression levels (Wyrick et al., 1999). TOP1 appears to be one of the genes that were induced in response to histone depletion. Figure 7 shows that initially, TOP1 was repressed, but then remained induced for 6 hours. There was a sharp dip in expression levels between 1 and 2 hours. Other genes that were induced in a similar way to TOP1 have functions such as chaperone activity, transporter activity, and protein binding (Figure 8). About two-thirds of the way down the list, there is a gene involved in single-stranded DNA specific endodeoxyribonuclease activity. This gene, like TOP1, cleaves single-stranded DNA. However, there are also many genes with similar expression levels to TOP1 that do not have the same function. It is difficult to determine only from these data if the similarly expressed genes have a common function or if they are expressed under these conditions for entirely separate reasons.
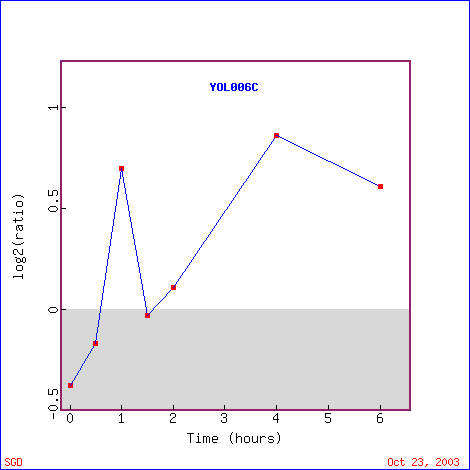
Figure 7. Expression levels of TOP1 after histone depletion. (Image from Expression Connection; SGD, 2003. Click here to view image.)

Figure 8. Similarly expressed genes to TOP1 after histone depletion. (Image from Expression Connection; SGD, 2003. Click here to view image.)
MLH1 is required for mismatch repair during mitosis and meiosis. During this experiment, the expression of MLH1 was increased in different cell lines and the expression levels of genes were measured. TOP1 seemed to have relatively consistent epxression levels when compared to normal conditions in two of the cell lines; however, in the second cell line TOP1 was induced (Figure 9). This is an interesting finding because TOP1 has a role in mitotic chromosome condensation and mitotic recombination, so it should be expressed during relatively similar time periods in the cell.
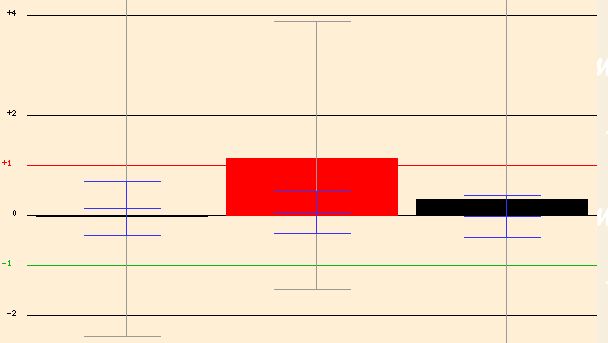
Figure 9. Expression of TOP1 with overexpression of MLH1. Image from <http://db.yeastgenome.org/cgi-bin/SGD/functionJunction>.
Figure 10 shows other genes that TOP1 is known to interact with. The genes include RNA polymerase genes, a Topoisomerase interacting factor, a gene involved in DNA strand breaks, and an unknown gene. The fact that TOP1 interacts with genes that have these functions is consistent with our knowledy of TOP1 activity. Since TOP1 is cleaves single-stranded DNA, it makes sense that it interacts with RNA polymerase genes (necessary for RNA synthesis, RNA is single-stranded, and RNA is transcribed from single-stranded DNA) and other genes that interact with Topoisomerases.
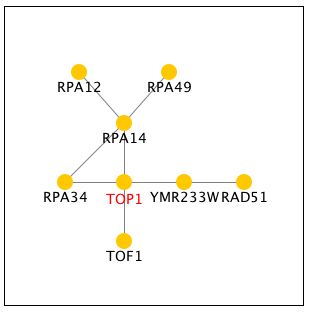
Figure 10. Genes with which TOP1 interacts. Image from Function Junction <http://db.yeastgenome.org/cgi-bin/SGD/functionJunction>.
From the microarrays I analyzed, I was able to find genes with similar functions to TOP1 that had similar expression patterns under certain conditions. Also, the expression of TOP1 under certain conditions proved to be consistent with its known functions. However, I also analyzed some data in which the genes with similar expression patterns to TOP1 did not seem to have a similar function. These findings illustrate the versatile uses of microarrays and also the complexity of the genome. It may be possible to hypothesize the function of an unknown gene by "guilt by association," but at the same time, it may be similarly expressed to genes that have a completely different functions. It is also possible that a gene may be expressed similarly to other genes that appear to have a completely different function, but it may be that not all the functions of the first gene are known yet. Microarrays have the potential to predict unknown gene functions and to find trends by grouping similarly expressed genes together.
YOL008W
I will now analyze microarray data to learn more about the expression levels of the non-annotated gene YOL008W and will attempt to further characterize its cellular role. "Guilt by association" will allow me to predict a role for YOL008W, but it will not allow me to determine its difinitive or absolute role.
Expression during sporulation (DeRisi, 1998). Click here to view the abstract.
During sporulation, YOL008W is increasingly repressed over time (Figure 11). After 11.5 hours, it has a repression level of -2.5 fold. This finding shows that high protein levels of YOL008W are not needed during sporulation, so YOL008W probably does not play a role in forming haploid cells, unless its normal function is to surpress the genes/proteins that are needed during sporulation. Several of the genes with similar expression levels to YOL008W have unknown functions, but others have functions such as transcription factor activity, electron transport acitivity, cleavage/polyadenylation specificity factor activity, cleavage/polyadenylation specificity factor activity, hydrolase activity, and others (Figure 12). There does not seem to be a trend in the functions of the similar genes; it seems the thing most similar between all of the genes listed are their expression levels during sporulation. TAF8, the first annotated gene listed, has RNA polymerase II transcription factor activity, which seems very different from my hypothesized function for YOL008W of lipid metabolism.
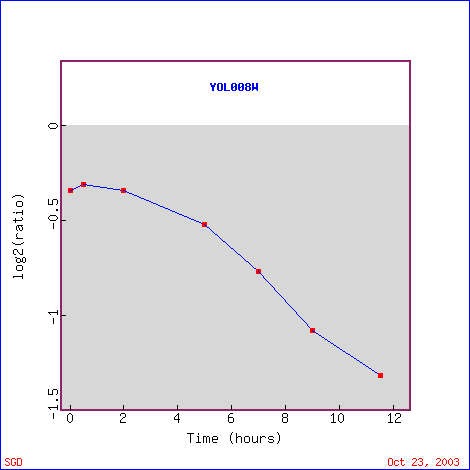
Figure 11. YOL008W is repressed during sporulation. (Image from Expression Connection, SGD, 2003. Click here to view image.)
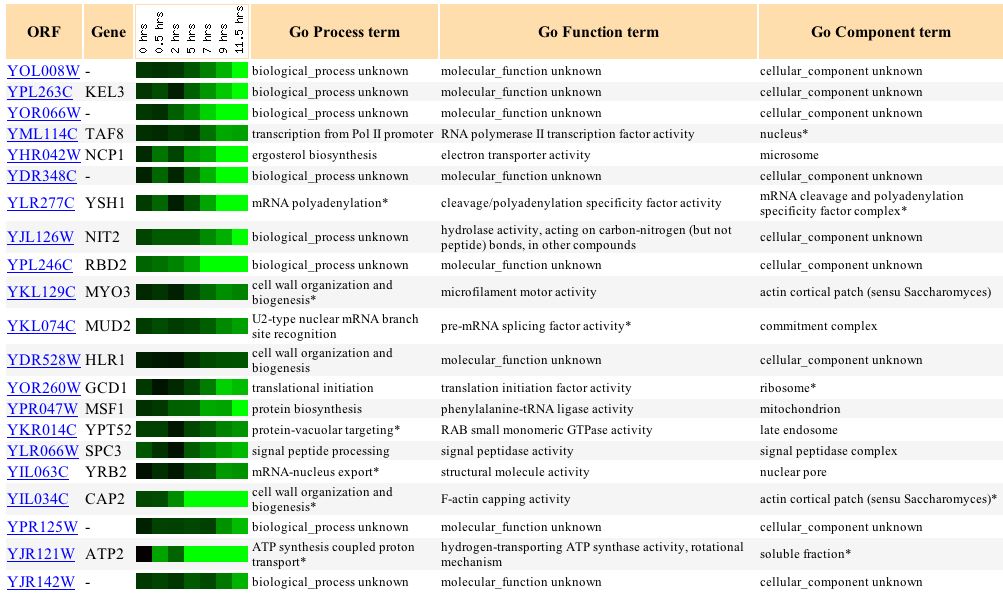
Figure 12. Genes with similar expression levels to YOL008W during sporulation. (Image from Expression Connection; SGD, 2003. Click here to view image.)
Expression in response to histone depletion (Wyrick, J.J., 1999) Click here to view the publication.
YOL008W was also repressed when histones were depleated from yeast cells. As Figure 13 shows, YOL008W was first repressed, then slightly induced after 1 hours, and then continued to be repressed until 6 hours. It's highest levels of repression are during hours 2 and 3. The genes that are similarly expressed to YOL008W are involved in protein biosynthesis, ER to Golgi transport, DNA replication, and others (Figure 14). Several of the genes appear to have a function involving ribosomes, which is a noteworthy trend. MRP7 is part of the ribosomal structure (large subunit) and is involved in protein biosynthesis and KRI1 is involved in ribosome biogenisis. Another slight trend in the genes genes is being involved in some kind of protein biosynthesis or transport. Some of the genes are localized in the nucleus, ER, or cytoplasm. Although there are some genes that appear to have similar functions to the others listed, there is not one single common trend. It is difficult to assess which proteins are more similar to each other than others, so it also makes it difficult to determine if YOL008W may have a function similar to any of these genes. It is possible that YOL008W is involved in a type of biosynthesis or transport. These data show a small consistency with the function that I previously hypothesized for YOL008W; based on "guilt by association," it may be located in the cytoplasm or nucleus and could be involved in a type of transport.
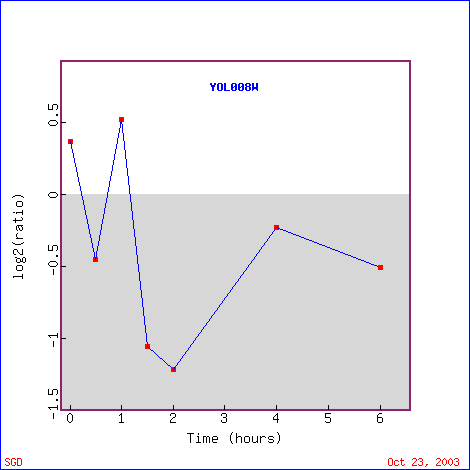
Figure 13. YOL008W expression in response to histone depletion. (Image from Expression Connection; SGD, 2003. Click here to see image.)
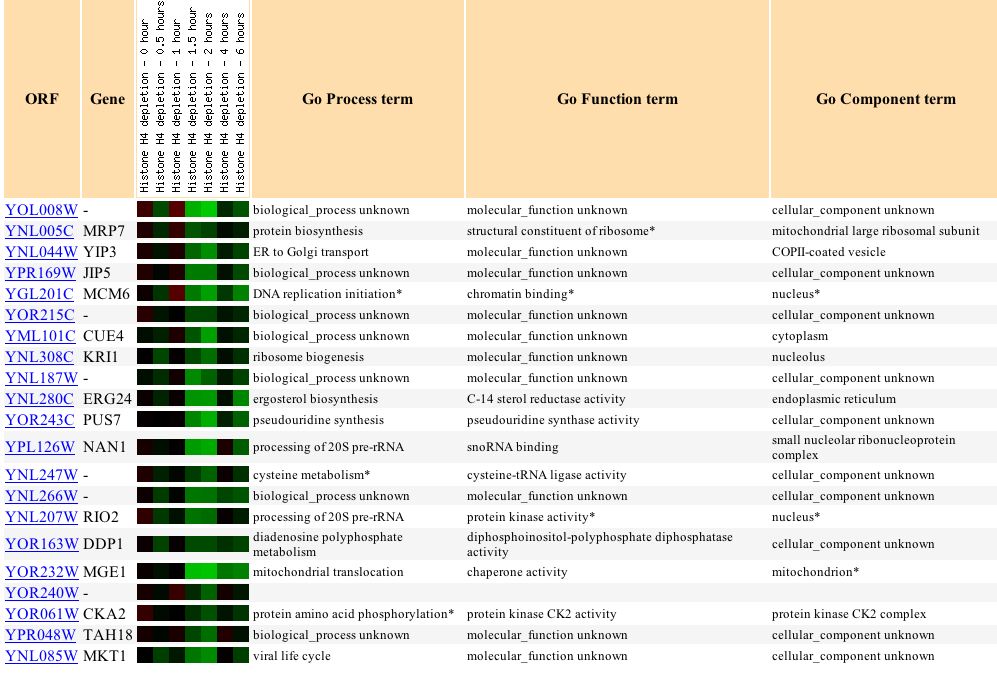
Figure 14. Similarly expressed genes to YOL008W in response to histone depletion. (Image from Expression Connection; SGD, 2003. Click here to see image.)
Expression during the diauxic shift (DeRisi, J.L., 1997). Click here to view the abstract for the publication.
Like TOP1, YOL008W was also repressed during the diauxic shift. It gradually was repressed more and more over time as the yeast cell went from fermentation to respiration so that by 20 hours, it was repressed by 1.8 fold (Figure 15).. This shows that YOL008W is not involved in respiration. Many of the genes that YOL008W was clustered with had unknown functions, but otheres were involved in pyrimidine metabolism, DNA replication and recombination, or protein transporter activity. Many of these genes would have cellular locations of the nucleus or cytoplasm, just at YOL008W is thought to be located in the nucleus or cytoplasm. Also, it is consistent with the previous hypothesis for YOL008W that it is involved in metabolism or transport.
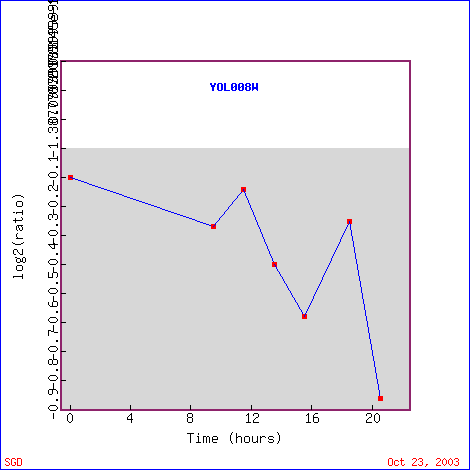
Figure 15. YOL008W expression during the diauxic shift. (Image from Expression Connection; SGD, 2003. Click here to view image.)
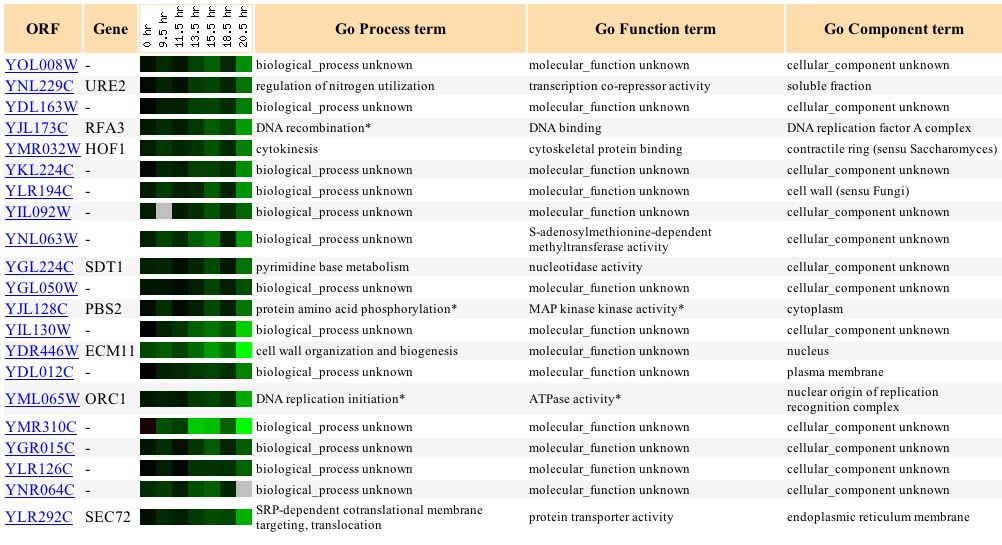
Figure 16. Similarly expressed genes to YOL008W during the diauxic shift. (Image from Expression Connection; SGD, 2003. Click here to view image.)
Expression in resonse to alpha-factor over time (Roberts, C.J., 2000). Click here to view the abstract of the publication.
There are two mating types of yeast: mating type 'a' and mating type 'aplha'. Each type responds to the opposite pheremone (ie. mating type a responds to alpha-factor pheremone) in preparation for mating. In this experiment, yeast were exposed to varying concentrations of alpha-factor in order to examine the expression of genes during pheremone signaling, cell cycle control, and morphogenesis (Roberts et al., 2000). YOL008W is repressed in response to alpha-factor. It is most greatly repressed between 100 and 200, but remains repressed during all concentrations (Figure 17). This suggests that YOL008W is not needed for the cell signaling pathways during mating or morphogenesis (shooming, its response to alpha-factor). Genes with similar expression patterns are located in the nucleus and cytoplasm, as well as mitochondrial chromosomes, ER, transcription factor complexes, and spindle pole bodies (Figure 18). YOR115C, the third gene on the list, is involved in ER to Golgi transport. In Figure 12, the third gene on the list is also involved in ER to Golgi transport. Other genes on this list are involved in redox homeostasis, copper ion import, mitotic chromosome segregation, DNA strand elongation, and mismatch repair. Many of the genes on this list appear to deal with DNA regulation, so perhaps YOL008W is located in the nucleus and involved with DNA regulation as well. It is also possible that it is involved in ER to Golgi transport as a transport molecule.
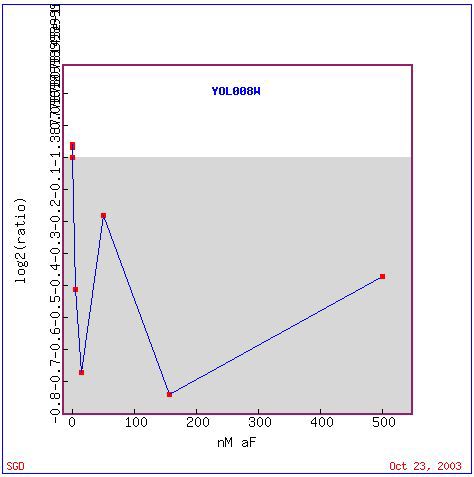
Figure 17. Expression pattern of YOL008W in response to various concentrations of alpha-factor. (Image from Expression Connection; SGD, 2003. Click here to view image.)
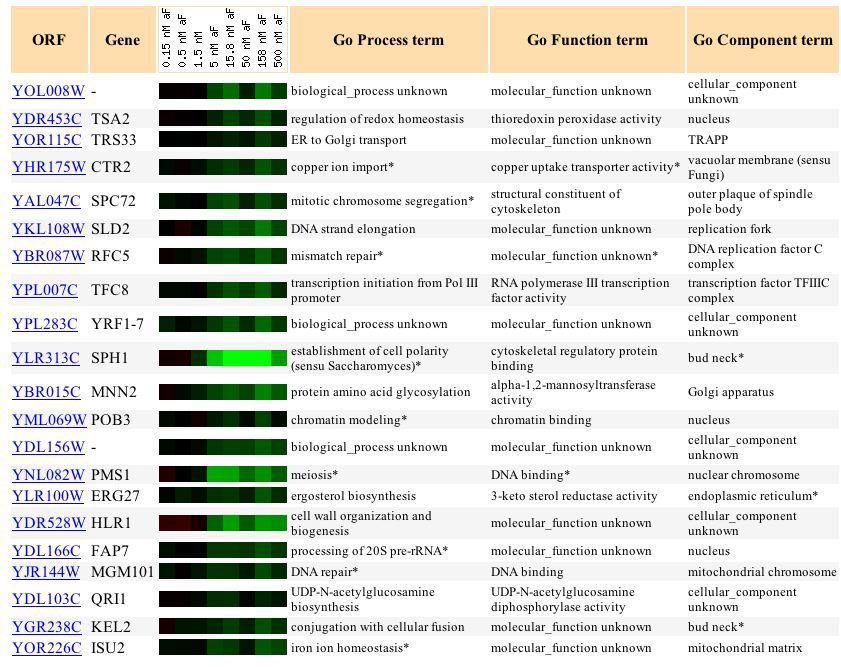
Figure 18. Genes with similar expression patterns to YOL008W in response to various concentrations of alpha-factor. (Image from Expression Connection; SGD, 2003. Click here to view image.)
In an experiment that examined the expression of yeast cells in response to the alkylating agent MMS, YOL008W was induced (Figure 19). Alkylating agents cause DNA damage by transfering an alkyl group, and can result in cell death. Since alkylating agents damage a cell, it seems that YOL008W was induced in order to counteract the cell damage. It is possible that YOL008W has a role in some type of cellular repair or other vital function when a cell is experiencing damage or death. It is interesting that in Figure 16, YOL008W was clustered with genes that functioned in DNA repair or other DNA functions, so perhaps YOL008W has a role with some time of DNA repair.
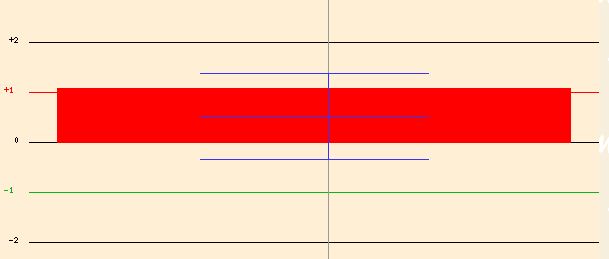
Figure 19. Expression of YOL008W in response to MMS. Image from Function Junction <http://db.yeastgenome.org/cgi-bin/SGD/functionJunction>.
In another experiment, the cells were exposed to high salinity concentrations over time. The expression of the cells in 1M NaCl were measured for 10 minutes, 30 minutes, and 90 minutes (Figure 20). YOL008W was highly expressed after 10 minutes (2.9 fold induction), but then the expression level greatly reduced after 30 minutes. At 90 minutes, the expressin level of YOL008W appeared to be relatively constant with expression levels during normal conditions. This is an interesting finding, because it shows that at first the cell elicits an "emergency response" to the high salinity; YOL008W is induced. Then after time it is repressed, as if the cell is trying to compensate for its high levels of expression at 10 minutes. Finally, the expression levels of YOL008W are restored to normal levels. This suggests that YOL008W is affected by salt concentrations, but the cell is able to adapt so that its expression levels can be restored to normal.
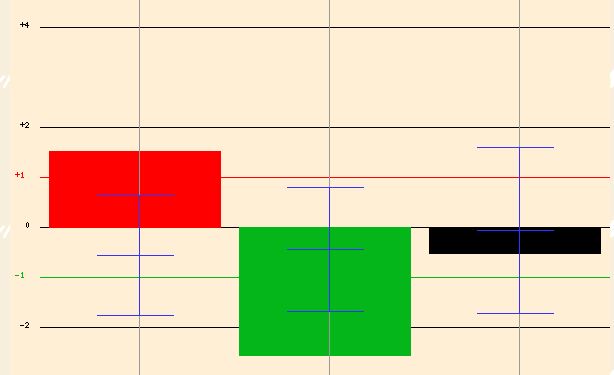
Figure 20. Expression of YOL008W in response to high salinity. Image from Function Junction <http://db.yeastgenome.org/cgi-bin/SGD/functionJunction>.
Function Junction also contained a chart with the average percentages of induction and repression for YOL008W during the experiments listed (Figure 21). The percentages of the time it is either induced or expressed seem relatively small, so perhaps this indicates that YOL008W is more often expressed at constant levels, even under many different conditions. Function Junction usually contains an image of the gene of interest in relation to other genes it interacts with or shares functions with. However, for YOL008W the only gene shown in the image is YOL008W. At first I thought, wow, there are no other genes with similar functions to YOL008W, but then I realized that it is possible that there are many genes that interact with YOL008W or many pathways it is involved in, but they are just not known yet. Also, perhaps the database was not updated with this information. This example demonstrates that databases can provide a wealth of information about genes and their functions, but also that you cannot make any conclusive decisions based on what is not shown in the database. There are still many things that we do not fully understand about the genome and the databases only cover a small portion of gene activity.

Figure 21. Percentages of induction and repression for YOL008W. Image from Fucntion Junction; <http://db.yeastgenome.org/cgi-bin/SGD/functionJunction>.
After viewing different microarray data, I have learned a little bit more about what kind of a role YOL008W has in the cell, but I still cannot determine its function. I learned that YOL008W is greatly repressed during sporulation, histone depletion, the diauxic shift, and in response to alpha-factor, so it seems that YOL008W is not involved in any of these processes. It is induced in response to a DNA damaging agent, and induced and then repressed in response to high salt concentrations. I learned a little more about its expression patterns during specific environmental conditions and I can hypothesize its function, but I cannot be certain exactly what role or roles it plays in the cell. Many of the genes with similar expression patterns were located in the nucleus or cytoplasm, so I would still predict that YOL008W has a role in either the cytoplasm or nucleus (as I hypothesized from sequence analysis). Some of the genes that YOL008W was clustered with have functions in transport (such as ER to Golgi), metabolism, DNA repair, or some type of protein biosynthesis. Some of these functions are consistent with my earlier predictions of YOL008W being involved in lipid metabolism/ransport or polyketide synthesis. I would like to revise my prediction regarding the function of YOL008W to include involvement in metabolism/transport of lipids or other molecules (in this case, YOL008W would be located in the cytoplasm), polyketide synthesis, or DNA repair or synthesis (located in the nucleus). The information available in online genomic databases is very useful to gain insight to the function of genes, both known and unknown; however, it also makes one more aware of that fact that the cell is an extremely complex unit and we are far from understanding it in its entirety.
Works Cited
Campbell, A. Malcolm and L. J. Heyer. 2003. Discovering Genomics, Proteomics, and Bioinformatics. Benjamin Cummings: San Francisco.
Chu S., DeRisi J., Eisen M., Mulholland J., Botstein D., Brown P.O., Herskowitz I. 1998. The transcriptional program of sporulation in budding yeast. Science 282: 699-705.
DeRisi J.L., Iyer V.R., Brown P.O. 1997. Exploring the metabolic and genetic control of gene expression on a genomic scale. Science 278: 680-686.
Ferea T.L., Botstein D., Brown P.O., Rosenzweig R.F. 1999. Systematic changes in gene expression patterns following adaptive evolution in yeast. Proc. Natl. Acad. Sci.96: 9721-9726.
Roberts C.J., Nelson B., Marton M.J., Stoughton R., Meyer M.R., Bennett H.A., He Y.D., Dai H., Walker W.L., Hughes T.R., Tyers M., Boone C., Friend S.H. 2000. Signaling and circuitry of multiple MAPK pathways revealed by a matrix of global gene expression profiles. Science 287: 873-80.
[SGD] Saccharomyces Genome Database. 2003. Expression Connection. <http://genome-www4.stanford.edu/cgi-bin/SGD/expression/expressionConnection.pl>. Accessed 2003 Oct. 24.
[SGD} Saccharomyces Genome Database. 2003. Function Junction.< http://db.yeastgenome.org/cgi-bin/SGD/functionJunction>. Accessed 2003 Oct. 24.
Wyrick J.J., Holstege F.C., Jennings E.G., Causton H.C., Shore D., Grunstein M., Lander E.S., Young R.A. 1999. Chromosomal landscape of nucleosome-dependent gene expression and silencing in yeast. Nature 402: 418-421.
Back to Sarah's Homepage for Genomics, Proteomics and Bioinformatics.
______________________________________________________________________________
Davidson College Biology Department
Davidson College Genomics Homepage
Sarah's Molecular Biology Homepage
Please send questions and comments to Sarah Baxter at sabaxter@davidson.edu. Thanks!