An implicit aim of synthetic biology is—putting it simply—to construct a cell that can do what a computer does. Friedland et al. explored this possibility by designing a synthetic gene network that could count, using two model networks. Although cellular mechanisms do vary between individuals, I discovered that each cell must reach a quantified threshhold stimulus that causes changes to occur. Cells often use counting mechanisms to instigate these phenotypic changes (such as cell division and cellular aggregation). The research group hoped to mirror the activity of digital cicuits and devices within the cells to predict the timing of observable changes.
|
|
|
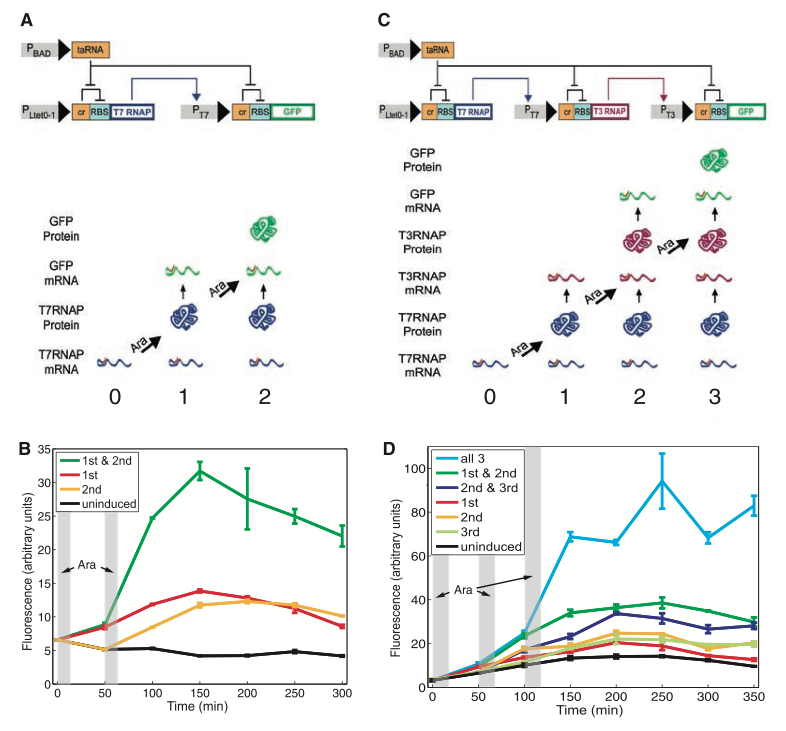
Figure 1. RTC Two-Counter and RTC three-counter construct designs and results
In the figure below, the group shows the physical design of both the RTC two counter and three counter models that they have constructed. In addition, they measured the fluorescence of their final reporter protein (green fluorescent protein) to gauge the success of protein production in the two constructs.
Fig. 1A shows us the detailed mechanism by which two pulses of arabinose will result in production of the green fluorescent protein. PLtet0-1 is a constitutive promoter that transcribes the T7 RNA polymerase (RNAP). The mRNA for this gene contains a cis-acting repressor (denoted by the “α” block) that forms a stem-loop with the ribosomal binding site RBS and prevents the gene from being translated. The first pulse of arabinose induces the weak promoter pBAD to transcribe taRNA. The taRNA reverses the repression of the “α” block by binding to it and exposing the RBS, allowing T7 RNAP mRNA to be translated. The polymerase is now able to bind to the T7 promoter and transcribe the gfp. The mRNA for the GFP also contains the repressive “α” block that prevents translation from occurring. At the second pulse of arabinose, pBAD transcribes another wave of taRNAs that bind to the “α” block and free the RBS site for translation of the GFP to occur.
Figs. 1C and 1A are similar in every way except that Fig. 1C contains one more protein and therefore requires one extra pulse of arabinose to express GFP in the cell. After the first pulse, T7 RNAP is translated like in the two-counter model; however, the subsequent gene transcribed is T3 RNAP. The second pulse of arabinose represses the cis-repressor in this gene and translates the T3 RNAP whose binding action eventually results in the GFP mRNA. The final pulse removes the cis-repressor on the GFP mRNA and expresses the protein.
In Figures 1B and 1D, Friedland et al. quantified the amount of GFP expression in both the RTC two-counter and three-counter models. In the two-counter model, two pulses of arabinose were administered at 0 minutes and 50 minutes for 10 minute intervals. Compared to the uninduced construct (black curve) in the two-counter model, the green curve depicts the highest level of GFP expression when both pulses of arabinose have been given to the cell. Although the red and yellow curves indicate times at which only the first pulse or the second pulse had been given to the cell, we still see greater GFP expression in comparison with the uninduced construct. This indicates that some “leakage” of GFP translation had occurred. This is possible because the taRNA present from the first induction can also undo the repression in the GFP mRNA and cause the protein to be expressed. The same reasoning also applies to the three-counter model. Pulses were applied three times for 10 minute intervals at 0, 50 and 100 minutes. When all three pulses are given to the cell, we see the highest expression of GFP. When two pulses are given, the GFP expression is higher than the uninduced construct. When any one of the three pulses is given, the GFP expression is slightly greater than the uninduced, but less than when two pulses were administered. The figures imply that the greater number of pulses given to the cell, the greater the likelihood of GFP expression. Of course, expression is significantly increased when all possible pulses have been given.
Image Courtesy of Friedland et al.
Figure 2. Model prediction and RTC three-counter experimental characterization
The figures below illustrate the results of a mathematical model that they created to support their results from Figure1. The group wanted to test how accurately they could use their mathematical algorithm to predict the fluorescence levels of the RTC two-counter and three-counters over time. Figs. 2A and 2B show the results of their algorithm (solid curve) against the experimental data (plotted points). Each curve shows us the fluorescence of the cells under a specific number of pulses (1, 2, or both pulses in Figure A or a combination of 1, 2, and 3 pulses in Figure B). In spite of some blatant outliers on the graph, Friedland et al. claim that the trend in their theoretical predictions appears to match well with the experimental points in both two-counter and three-counter models.
In Figs. 2C and 2D the group illustrated another mathematical model that predicted how the pulse frequency and pulse length contributed to fluorescence. Their goal in panel C was to pinpoint the ideal number of pulses and the ideal duration of the pulse administration and couple them to get the maximal fluorescence. The widest portion of the contour lines indicates combinations of pulse length and interval during which high levels of fluorescence were obtained. This “sweet spot” occurs at a pulse length between 20 and 30 minutes and pulse interval between 10 and 40 minutes. To substantiate these findings, they plotted experimental data in which they had sampled different pulse lengths and intervals. The larger and darker colors (scale on the right side of graph) of the circles indicate combinations of length and interval that had resulted in the greatest fluorescence. As the contour lines spread too far apart or too close together (high and low extremes on the axes), noise renders the counting mechanism inefficient. Friedland et al. attributes these limits to the kinetics of intrinsic biological mechanisms. Panel D further shows that there is no difference in GFP expression between two and three count models. The pulse interval and length remains the same as panel C. Also, experimental values in D show that differences outside of the “sweet spot” contributed little to fluorescence, as seen by smaller and bluer dots.
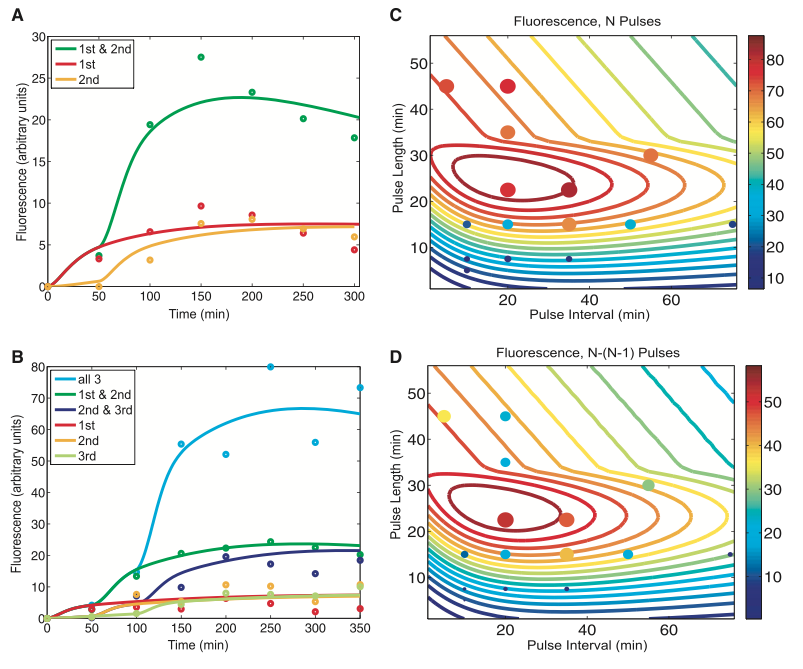
Image Courtesy of Friedland et al.
Figure 3. The single-inducer DIC three-counter construct design and results.
The figure demonstrates the group’s second three-counter design, the effectiveness of the design, and their attempts to maximize its output. In panel A, we see the model of a singly induced DNA invertase cascade (DIC) three-counter. With each pulse of arabinose, the pBAD promoter is induced to transcribe the mRNA for the flpe recombinase, cre recombinase or gfp. Unlike the previous model in Figure 1, there is no repression of the ribosomal binding site. Rather, we see that each unit—called a Single Invertase Memory Module (SIMM) — contains a promoter that is made functional by initiating inversion with a pulse of arabinose so that transcription and translation are uninterrupted. Each of the two SIMMs contains the inverted promoter, a recombinase gene, an ssrA tag (rapidly degrades the recombinase to prevent multiple reversals) and a transcriptional terminator (Term) all flanked by recombination sites. Upon the first pulse of arabinose, the pBAD promoter upstream of the first SIMM transcribes the flpe recombinase. The protein binds to the FRT recombination sites to invert the SIMM so that the newly transcribed gene is now reversed, and the previously inverted promoter is in its proper orientation to transcribe downstream genes. A second pulse of the inducer instigates transcription of cre. Creinverts between the loxP sites and places the final pBAD promoter upstream of the gfp. A final pulse of arabinose transcribes the mRNA for GFP.
Panel B uses flow cytometry to illustrate the mean fluorescence of the single-inducer DIC three-counter constructed in panel A over time. The shaded region represents duration of each pulse. Three pulses were administered, each lasting for about 8 hours. As the group expected, they saw a dramatic increase in GFP expression following the third pulse because this was when the third promoter should have inverted to produce the fluorescent protein. From this figure, we also note that there is some leakage of fluorescence occurred after only one or two pulses of arabinose. These data indicate that some premature reversing of the cre or gfp genes had occurred, possibly due to an excess of induced pBAD.
In Panel C, the group attempts to correct for the leakage seen in panel B by manipulating the pulse intervals and lengths to gauge which parameters result in the greatest difference of fluorescence between two pulses and three pulses or arabinose. The three-dimensional figure shows the pulse length and pulse intervals on the x and y axes, while the resulting fluorescence is shown on the z axis. The highest point on the curve occurs at a pulse interval of approximately 11 hours and a pulse length of 8 hours, suggesting that these parameters give the greatest resolution of fluorescence between two and three pulses of arabinose. The black points on the curve are all experimental values plotted over the intervals that were tested. A value lies at the apex of the peak with the greatest fluorescence.
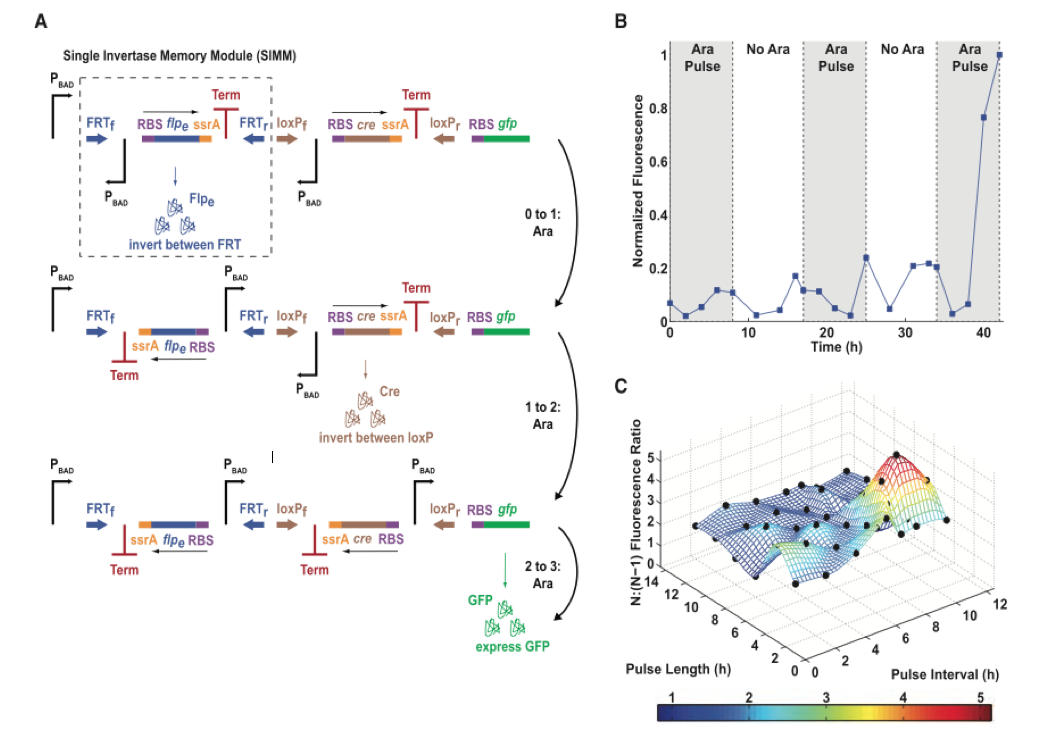
Image Courtesy of Friedland et al.
Figure 4. The multiple-inducer DIC three-counter construct design and results
Friedland et al., demonstrated the modularity of their design by using the DIC-three counter from their previous figure, except they engineered three different promoters instead of one promoter. Each promoter pLtet0-1, pBAD, and pA1lacO was uniquely inducible by anhydrotetracycline (aTc) , arabinose (Ara), and iso-propyl ß-D-1-thiogalactopyranoside (IPTG) respectively. The construct in Panel A contained two SIMMs. The first gene was induced with aTc at which point Flpe was produced to invert the first SIMM and place pBAD in its proper orientation. Inducing pBAD arabinose caused Cre to invert at the loxP sites and placed the final uniquely inducible promoter p1lacO upstream of the gfp gene.
In panel B, the group experimented with all different permutations of their inducers to observe how the order of administration affected the fluorescence. The pulses were administered continuously throughout the times indicated. The combination in which aTc was pulsed first, arabinose second, and IPTG third gave resulted in the highest level of normalized fluorescence following the third pulse. As was expected, no other combinations of the inducers produced this drastic result. By using the different inducers, the group hoped to control for any accidental induction of the wrong promoter; however, we can still see that the aTc-IPTG-Ara and IPTG-aTc-Ara combinations produced somewhat higher than baseline levels of fluorescence before the third pulse. The leakage may have been due to premature inversions of the recombination sites, as was the case in the singly-induced model.
Panel C uses flow cytometry to demonstrate that a greater number of cells fluoresce when all three inducers are present. The curve shifts to the left for singly-induced promoters because fluorescence decreases with one inducer. We also see that any inducer on its own functions at approximately the same capacity. Panel D shows that no combination of two inducers can match the fluorescence that all three functional inducers emit when administered correctly. Both C and D together use the specificity of this design to show that when all inducers are administered in the proper order, the module is clearly able to count.
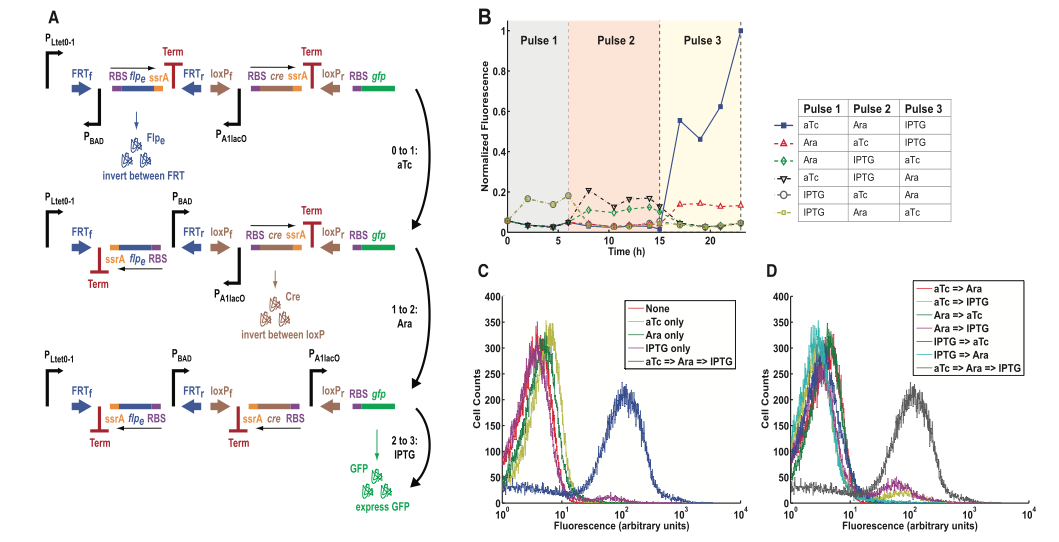
Image Courtesy of Friedland et al.
I thought Friedland et al. made a complex and innovative topic very accessible to their readers. The notion that a cell must cross chemical, physiological thresholds which cause it display an array of phenotypes is not unfamiliar to us. Yet, this group did a fine job of delineating a possible mechanism for signaling that could be manipulated easily by the user.
I particularly liked the representations of their induction pathways, and especially appreciated the diagram beneath the construct that showed which molecules exist before and after pulses. Having a stepwise illustration made it convenient for me to comprehend what is expected after each pulse. A particular element of confusion in Panels B and C of Figure 1 was the depiction of curves that received only “2nd pulse”, “3rd pulse” and “2nd and 3rd pulse”. I thought the authors could have done a better job of explaining that the cell itself only experiences one pulse overall in the first two cases, and two overall pulses in the third instance. From what I finally understand, the only difference between “2nd” and “3rd” curves and the curves experiencing “1st” and “2nd” is in the amount of time between pulse administration and the data collection. Additionally, if they included curves in which “1st and 2nd” and “2nd and 3rd” pulses were given, why wouldn’t they include a curve of “1st and 3rd” pulses, when the only difference is in the timing? Or is a difference in timing the only reason why this curve was not included?
Though all their figures were generally strong, I thought that the 3D representation of pulse length and interval’s influence on fluorescence in Figure 3C was absolutely brilliant. At first, I wondered why they chose to represent the data in Figs 2C and 2D differently from this panel, soon realizing that the 3D image displays a ratio between two and three pulses while Figure 2 displays differences between two and three pulses. The beauty of this representation is that it requires much less effort to interpret than Figs 2C and 2D, while predicting behaviors at fractional lengths and intervals. Isolating the peak of maximal fluorescence is extremely easy because both color and height of the peak indicate fluorescence levels.
I was initially skeptical about the utility of displaying both Panels C and D in Figure 4. After all, in combination with panel B, the figures repeatedly show the same and expected results: only aTc-Ara-IPTG administered in this particular order can result in the significantly increased fluorescence. The authors have demonstrated that no other possible combination of single or double induction can give this same output. I eventually came to appreciate that this data is as much quantitative as it is qualitative.
An important application of cellular counting that the authors discuss is the ability to mediate cell death. They were able to christen each of their constructs—the RTC counters, single and multiple inducer-DIC three-counters—with a relevant application. I envision the relevance of cellular counting in cancer research, where cell death upon reaching a quantifiable threshold of toxicity is essential to survival. In the face of this vital application, however, I found myself asking the obvious question: how would one proceed to scale up these constructs and what issues do we anticipate facing as we move past a simple three-counter design? These are questions that groups in the synthetic biology playing field will have to tackle as they push the boundaries of this innovative study into the clinical realm.
Take me back to Shamita's Homepage.