The goal of this study was to characterize a collection of seven known genomic sequences of prostate cancer tumors to understand the types of genomic alterations in each of them. Prostate cancer is the second leading cause of male cancer deaths in the United States. Surprisingly, all analyses of the prostate cancer sequences before this paper have focused on what are termed gene-coding “driver” alterations, ones that are postulated to directly instigate the cancer. The authors attempted the first whole genome sequence analysis of human prostate cancer. They gathered DNA from seven patients with “‘high-risk’ primary prostate cancer” and employed paired-end sequencing on both tumor and corresponding normal genomic DNA in these patients.
|
|
To further their experimental design, Berger et al. also studied whether regions prone to genomic rearrangement contained similar transcriptional patterns or chromatin marks linked to their tendencies for rearranging. I was not aware that hormones such as androgen can cause genes to co-localize, or associate together, resulting in a balanced chromosomal breakage. Berger et al. used published data from an androgen sensitive prostate cancer cell line called VCaP to assess the spatial correlations of the rearrangements. A comparison of the rearrangements patterns they had discovered in the prostate cancer genomes with patterns in various other cancers helped them understand the prevalence of a particular genomic rearrangement in the cancerous phenotype. They noticed that genes in the prostate cancer tumors such as CSMD3, CADM2 (cell adhesion molecule 2), PTEN (tumor suppressor gene), and MAG12 (membrane associated guanylate kinase) had greater tendencies to rearrange. Both the frequencies of the rearrangement in these genes and their implications in prostate cancer were presented. |
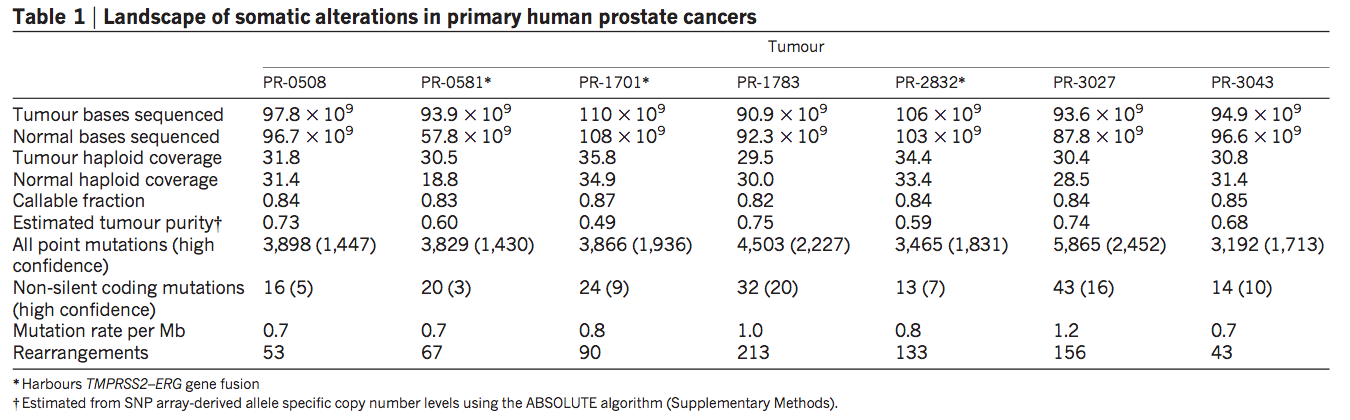
Table 1. Landscape of Somatic Alterations in Primary Human Prostate Cancers
The table provides a categorized summary of the type and frequency of all mutations harbored in the seven prostate cancer genomes. In the legend below the table, we can see that the starred tumors indicate a fusion-positive rearrangement. Information in the table tells us that the number both tumor and normal bases sequenced across all seven tumors genomes were approximately the same, given that the order of magnitude did not differ. In addition, tumor haploid coverage indicates that only one allele was sequenced in each of the genomes. With this method lies the assumption is that only one mutation in either allele is necessary to cause cancer (what about loss of function, and the other allele). Callable fraction refers to the certainty with which we can call label polymorphisms within the genome. The fraction decreases as the number of repeats increase. The fusion-negative genome PR-3027 contains the highest number of point mutations, and non-silent coding mutations.
Image Courtesy of Berger et al.
Figure 1. Graphical Representation of seven prostate cancer genomes
Below are Circos plots, in which the seven prostate cancer genomes are represented circularly to show the gene copy numbers and both intra- and inter- chromosomal rearrangements and translocations respectively. The top row contains the three ETS fusion-positive genomes, while the bottom row contains four ETS fusion-negative genomes. Each chromosome is numbered and color coded in the outer ring. All purple lines indicate regions of the genome that have been translocated from one chromosome to another. The green lines indicate sites of rearrangement within a specific chromosome. Additionally, the inner circle of each genome indicates the copy number variation of genes in that region with red regions signifying a copy gain and blue regions signifying copy loss. When it comes to the frequency of rearrangements and translocations, there is much variation between genomes in this figure. For example, in PR-2832, PR-0581, and PR-3027, translocation of several genes appears to occur consistently between two specific chromosomes. Also, intra-chromosomal rearrangements appear to occur at a higher rate in PR-3027 and PR-1783 than in other genomes. At the same time, PR-1701 has fewer translocations and rearrangements, but the rearrangements that do occur are concentrated on a single chromosome. Finally, PR-3043 has fewer rearrangements and translocations than any other genome in the figure. Such diversity in the frequency and location of the rearrangements indicates that the cancerous status can occur under a wide range of genomic alterations.

Image Courtesy of Berger et al.
Figure 2. Complex structural rearrangements in prostate cancer
This figure allows the authors to elaborate on the idea of “balanced translocations”, which they define as the exchange of DNA between two chromosomes without the loss of genetic material. Figure 2a shows a pictorial representation of a balanced translocation. Four loci numbered 1 through 4 are depicted on the left side. Each loci is then divided in half (A and B). The arrows that connect the split set of fragments indicate how a rearrangement between the eight halves has occurred to produce what are termed “chimaeric” chromosomes. Understanding where rearrangements occur is crucial because a given rearrangement could result in a truncated protein. The paper gives some examples of rearranged genes—such as the CHD1 chromatin modifier— that resulted in non-synonymous amino acid substitutions and damaged protein.
Figure 2b focuses on the rearrangement patterns that resulted in the TMPRSS2-ERG gene fusion on PR-1701. Four loci, two each on chromosomes 1 and 21 are color coded and magnified to show how an equal exchange of genetic material occurs between them. The blue lines indicate the intra-chromosomal exchange of genetic material, while the purple lines indicate an inter-chromosomal exchange. A balanced rearrangement occurs at each of the small colored bars within the loci. Below the tumor genes are the normal genes. We can see that no rearrangements have occurred in these genes compared with the ones above it.
The bottom half of Figure 2b shows the four loci on the two chromosomes before any rearranging has occurred (see how colors correspond to their regions on the chromosomes). After breakage occurs, the arrows between the two halves illustrate how rearrangement occurs to result in the final genetic material. We can see that TMPRSS2-ERG fusion has occurred on two loci found within the same chromosome. Notice that although some fragments have been translocated on the opposing strand (shown with arrows), the chromosomes overall maintain the same amount of genetic material, resulting in what is called a “closed quartet” exchange. I assume that quartet refers to the four loci partaking in translocation.
Finally, Figure 2c is a complex model of balanced rearrangements that occur in 9 distinct regions (marked by 9 different colors) between chromosomes 12, 5, 17, and 9 in PR-2832. Again, we see that a similar rearrangement of whole genes results in several combinations of new loci. Many of the rearranged genes, such as MAP2K4 and TBK1 are cancer-related. The figure implies that a disruption in these cancer-related genes is what gives rise to the PR-2832 genome.
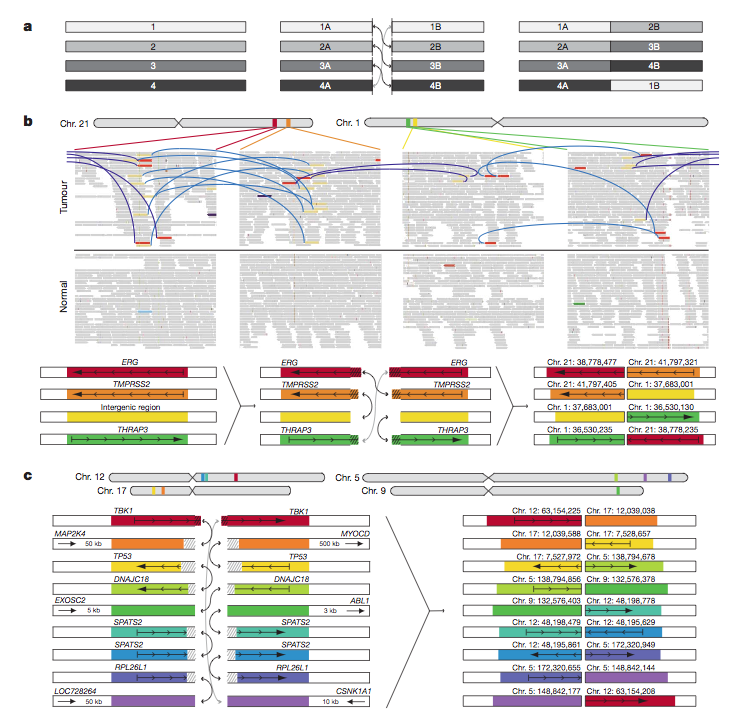
Image Courtesy of Berger et al.
Figure 3. Association between rearrangment breakpoints and genome-wide transcriptional/histone marks in prostate cancer
The purpose of this figure is to show how different types of epigenetic chromatin markers on a chromosome influence the number of rearrangement sites. The figure compares the rearrangement effects of various methylation and hormone signaling events between fusion positive and fusion negative cancer genomes. The chromatin immunioprecipitation and massively parallel sequence (ChIP-seq) data from a previously published study of an androgen sensitive prostate cancer cell-line (VCaP) is used to understand how androgen signaling causes the TMPRSS2-ERG locus to co-localize. Co-localization can refer to several genetic phenomena (see for example Transcription factor co-localization in fruit fly); however, in this instance, it refers to the tendency of genes to rearrange together due to a suspected relationship between their functions. Compared to a coverage matched simulated background, the figure shows that all epigenetic markers except for histone H3K27 trimethylation cause enrichment in the number of rearrangement sites in fusion positive tumors in open chromatin regions. On the contrary, there is a depletion of rearrangement sites in fusion negative tumors where transcription occurs and enrichment near closed chromatin. Prendergast et al. highlights that the difference between open and closed chromatin is that open chromatin is unwound and more freely floating. Furthermore, the regions of open chromatin are often “gene dense” and varied (Prendergast et al., 2007). The depletion supports the co-localization theory because many of the fusion negative tumors had a depletion of rearrangements sites where transcription actively occurs. Thus, the cell tends to “avoid” rearranging in regions where proteins are actively being made so as to not disrupt functional stability. The data in this figure can suggests that the effects of epigenetic markers differ based on whether the cancer genome is fusion positive or fusion negative.
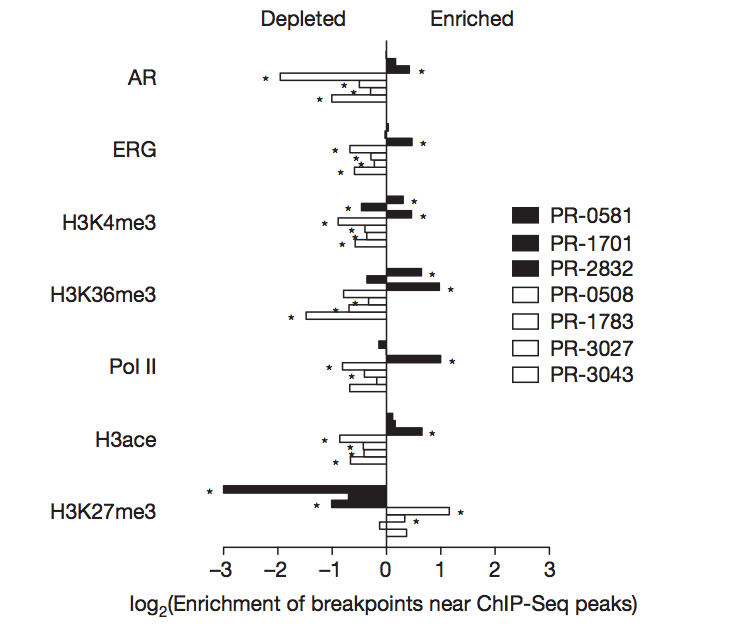
Image Courtesy of Berger et al.
Figure 4. Disruption of CADM2 and the PTEN pathway by rearrangments
The purpose of this figure is to analyze recurring non-chance rearrangements in three genes (CADM2, PTEN and MAGI2) across both fusion positive and fusion negative prostate tumors. The CADM2 protein encodes a nectin-like member of cell adhesion proteins. Many nectin-like proteins exhibit tumor suppression properties. Figure 4a outlines the different types of rearrangements found in one fusion positive and two fusion negative cells. Only one intragenic breakpoint was detected in PR-0508 (fusion positive), but several deletion and inversion sites were located in PR-1783 and PR-3027 (fusion negative). The inversion even spans outside of this gene’s region. To visualize the breakpoint in CADM2, a florescence in situ hybridization (FISH) was performed in Figure 4b. A red and green fluorescent probe bound to the two ends of the gene. We can see that the wild type gene is still whole, while the break-apart probes are located farther apart. Additionally, the PTEN tumor suppressor gene was studied in Figure 4c because two prostate of the four fusion positive tumors exhibited breakpoints in this gene. The other two tumors contained rearrangements that interrupted a PTEN-interacting protein called MAGI2. To confirm the occurrence of two suspected inversions in the MAGI2 gene, FISH was performed with three probes. In the wild type probe, the probes are bound in the order green-red-green. In the rearranged gene, the probes are bound in the order green-green-red, indicating that an inversion has occurred between a green and red locus. The main difference between the PTEN and MAGI2 rearrangements is that some PTEN rearrangements involve a copy loss (deletions) while the MAGI2 are balanced translocations. The results appear to indicate that rearrangements in these tumor suppressor genes contribute to prostate cancer. The MAGI2 gene in particular was found to be rearranged in a melanoma cell line.
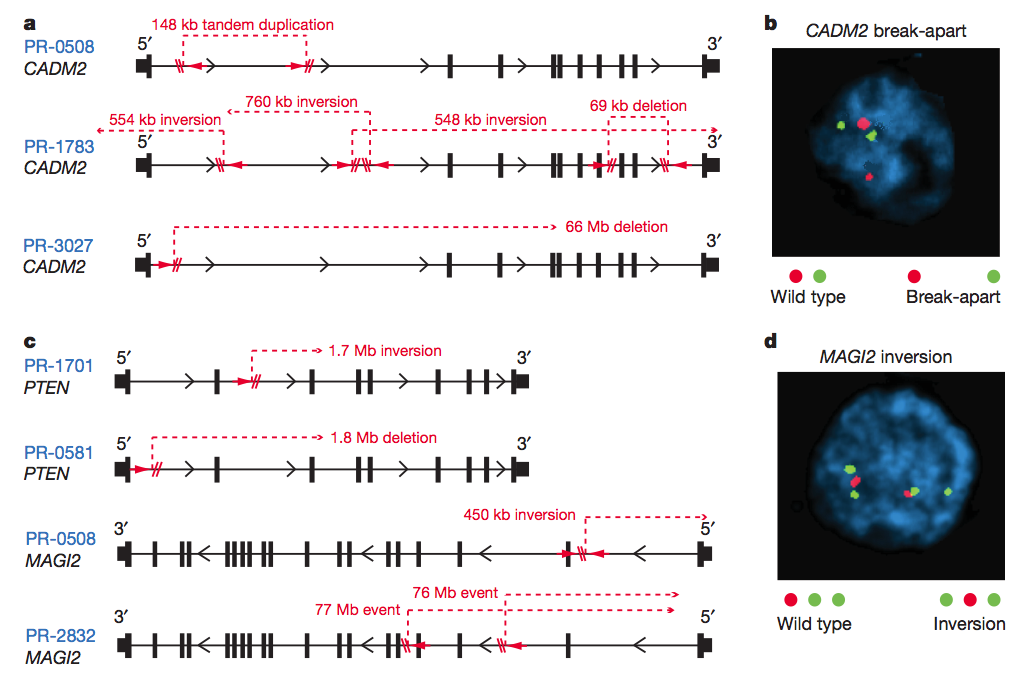
Image Courtesy of Berger et al.
Overall, I think this paper provides substantial background information and detail explaining how translocations and rearrangements are a strong driving force between prostate cancers. Using the Circos plots in Figure 1 was a convenient and organized method of illustrating how translations and rearrangements vary across the in the prostate cancer genomes. Additionally, I thought it made a powerful statement that the cancerous effects are still evident under varying extents of rearrangements. While Figure 2 explained the concept of balanced rearrangements clearly, I observed some flaws in specifying terminology. For example, the authors suddenly introduce the “closed chain” pattern of breakage, which they appeared to have coined without any previous introduction of the term. Without any previous context, recurrent use of this term becomes confusing throughout the paper. In addition, they made a resourceful use of the colors in Figure 2; however, I thought they could have better specified the basis for colors of the bars in each of the four loci in Figure 2a. The caption states that the colored bars specify discordant read pair. But if the colors on the chromosome pertained to the four named genes, then what did the small colors of the bars represent? If understanding the colors is any point of confusion, I feel that the authors could have provided more details to make interpreting this figure less ambiguous. On the other hand, the rearrangement patterns in Figure 2c were clear, easy to follow and visualize.
The section on spatial co-localization of genes fascinated me, but unfortunately, I thought Figure 3 was the most difficult of all to understand. It appeared to convey a different from the text. In the graph, the prostate cancer genomes are all separated into two categories: black for fusion positive and white for fusion negative. There is no way of telling which specific fusion positive or fusion negative genome is represented by any given bar. The text, however, refers to “other ERG fusion-positive tumors (PR-0581 or PR-1701), [in which] correlations between breakpoints and ChIP-seq peaks were intermittently apparent, albeit much less significant”. When I look at the graph, I know neither which black bars refer specifically to those two genomes, nor which epigenetic markers the genomes are associated with. Such a statement in the text is both vague and confusing in context with the figure. Figure 4 was simpler to analyze because the color helped categorize various parts of the figure. It is obvious from Figure 4a that the CADM2 rearrangements are complex, and even the authors stated that analysis with FISH would likely prove insufficient to gauge the extent of CADM2 disruption. In spite of this conclusion, they still perform FISH on the gene. Their conclusion obviously contradicts their method. It makes me wonder what point they were trying to make by carrying out an analysis that they knew would inaccurately represent genomic rearrangements of CADM2.
At the conclusion of their work, the authors emphasize the necessity of whole genome sequencing to further understand the mechanism of rearrangements in the prostate cancer genomes. I agree with them, especially given that previous attempts at understanding rearrangements focused only on exon region, or hybrid genes. But we now know that there are many regions outside of the immediate gene itself—such as targets of epigenetic markers and transcriptional regulation—that can be affected by chromosomal breakage. Understanding the effects of genetic disruption caused outside of exons would help us understand how aggressiveness of a rearrangement in a genome and whether we can engineer the tools to fight it.
Take me back to Shamita's Homepage.