![]()


![]()

In sum, Figure 1 provides three key representations of the methods Stiffler et al. used:
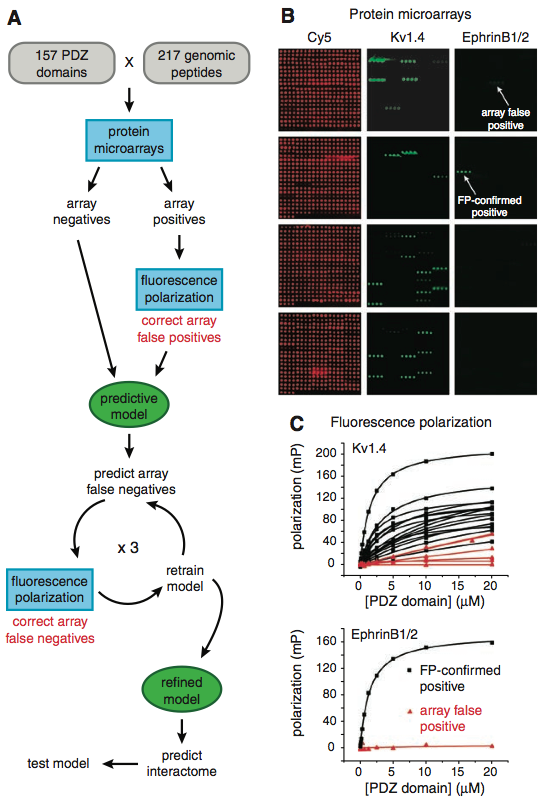
Panel A is a schematic of the authors' model, showing that they compared 157 PDZ domains and 217 peptides first using the protein microarray. Next, they further analyzed the array-indicated interactions (positives) with Fluorescence Polarization (FP) to separate true from false positives. Then, both the array negatives (non-interactions) and corrected positives were subjected to their predictive model, which predicted the false negatives. FP was performed again to correct the false negatives, and, using these data, they retrained the model. This process occurred three times, after which they used their refined model to predict PDZ domain-peptide interactions. Panel B provides a representation of one of their protein arrays, in which each PDZ domain was spotted four times (hence the four sequential dots on the two most right columns). Cy5 (left column) shows the location of the PDZ spots. Kv1.4 and EpherinB1/2 are two of the fluoresently tagged peptides they used as probes for the PDZ domain spots. In the right column, the authors point out the difference in fluorescence intensity for the true (brighter signal) versus false (weaker signal) positives. Panel C depicts their FP data, with the degree of polarization on the y-axis and the PDZ domain concentration on the x-axis. They used the FP data to make a distinction between the actual and false positve PDZ domain-peptide interactions they obtained from Panel B's microarray data, with the higher polarization values generally representing a confirmed positive. The top graph shows the Kv1.4 peptide data, with the red lines representing false positive data and the black representing confirmed positive. The bottom graph is similar, just with the ephrinB1/2 peptide data.
![]()

For ease of comprehension, the explanations of Figure 2 are broken up into two parts below: (Panels A&B and C-E)
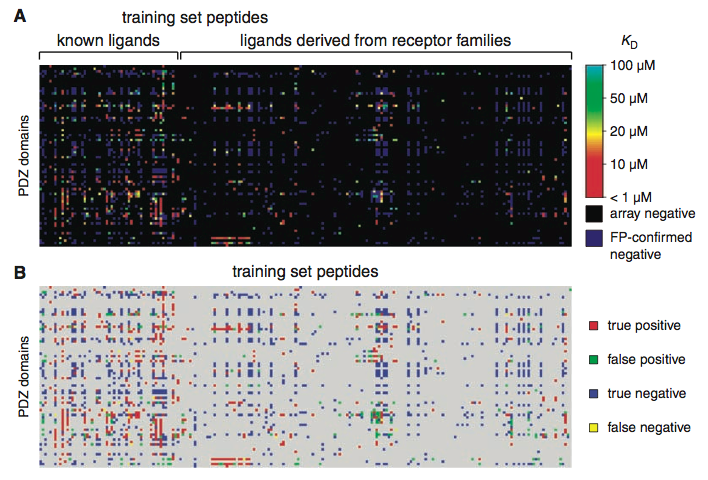
Panel A depicts the PDZ domain-peptide interactions following protein array, model prediction, and FP analysis. The spectrum of colors represent dissociation constant (KD) values (high binding probability = red; lower binding probability = light blue) of the fluoresence(FP)-confirmed interactions . The black and dark blue spots represent the array and FP-confirmed non-binding (negatives), respectfully. The researchers note that 44% of the array false negatives predicted by their model were confirmed by FP to be positives after all. Panel B shows the performance of their model (MDSM) using the updated data set. FP confirmed 536 true interactions (positives; red), of which their model predicted 96% (515). Furthermore, out of all the non-interactions (negatives), their model predicted them to be positives only 15% of the time (yellow).
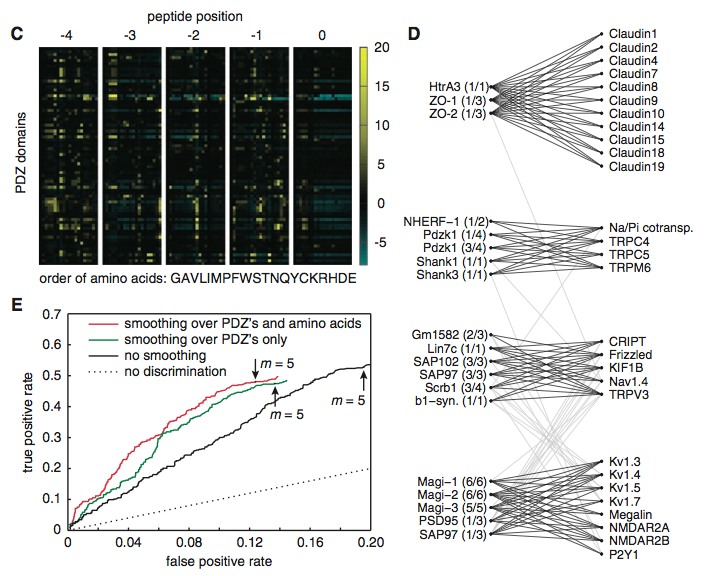
Panel C uses a heat map to depict the parameters of their MDSM model for discriminative binding, demonstrating that the peptide-PDZ domain binding relationship is in part dependent on the c-terminus position (-4 to 0 on the top of the columns). Positive contributions (the amino acid facilitates binding at that position) are graded towards yellow, whereas negative contributions (amino acid hinders binding in that position) are graded towards light blue. Darker colors on the color scale mean that amino acid neither facilitates nor hinders binding at that position. It appears that the peptides' amino acids and positions appear to influence whether PDZ domains will bind to them. Panel D shows clusters of PDZ domains (left) and their peptide binding partners (right) that resulted from using a cluster algorithm to find binding selectivity relationships. It is clear that specific binding relationships are present, although components of some clusters also interact with other clusters. Panel E shows the performances of three versions of MDSM using a new, previously untested set of 48 peptides from the mouse proteome that were already predicted to bind to PDZ domains. As the graph shows, when they smoothed over both the PDZ domains and the amino acids (red line), the model performed the best with a higher rate of true positives (y-axis) and the lowest rate of false positives (x-axis). In other words, further refinement of the model from the former version (black line) improved its accuracy when detecting interactions; however, in all three versions of the model, it performed better than if no discrimination (prediction) were used.
![]()

Again, for ease of comprehension, the explanations of Figure 3 are broken up into three parts below: (Panels A-C, D-F, and G&H)
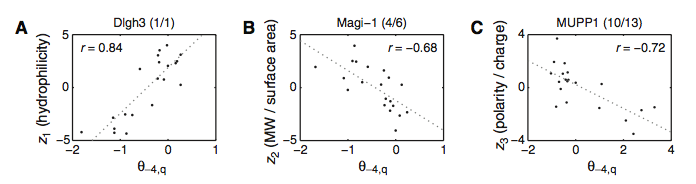
As this figure depicts, the researchers wanted to further resolve the binding selectivity of the PDZ domains. More specifically, they wanted to know which physiochemical properties (such as hydrophilicity, molecular weight? (MW)/surface area, and polarity/charge, denoted Z1, 2, and 3, respectively) contribute to PDZ domain binding at each position of the peptide ligands. Panels A-C all show extreme examples of their findings, as domain selectivity usually depends on multiple properties (Zs), but the following panels are examples where only one Z contibute to binding selectivity. Panel A shows the selectivity for Dlgh3 at position -4. As you can see, the probability of binding (θ; x-axis) increases with hydrophilicity (y-axis) at this position. On the other hand, in panel B, a negative correlation exists for Magi-1 at position -4 between MW/surface area and the probability of interaction. Lastly (panel C), MUPP1 at position -4 also shows a negative correlation between polarity/charge and probility of binding. These panels highlight the selectivity differences among different proteins and PDZ domains, all at the same position.
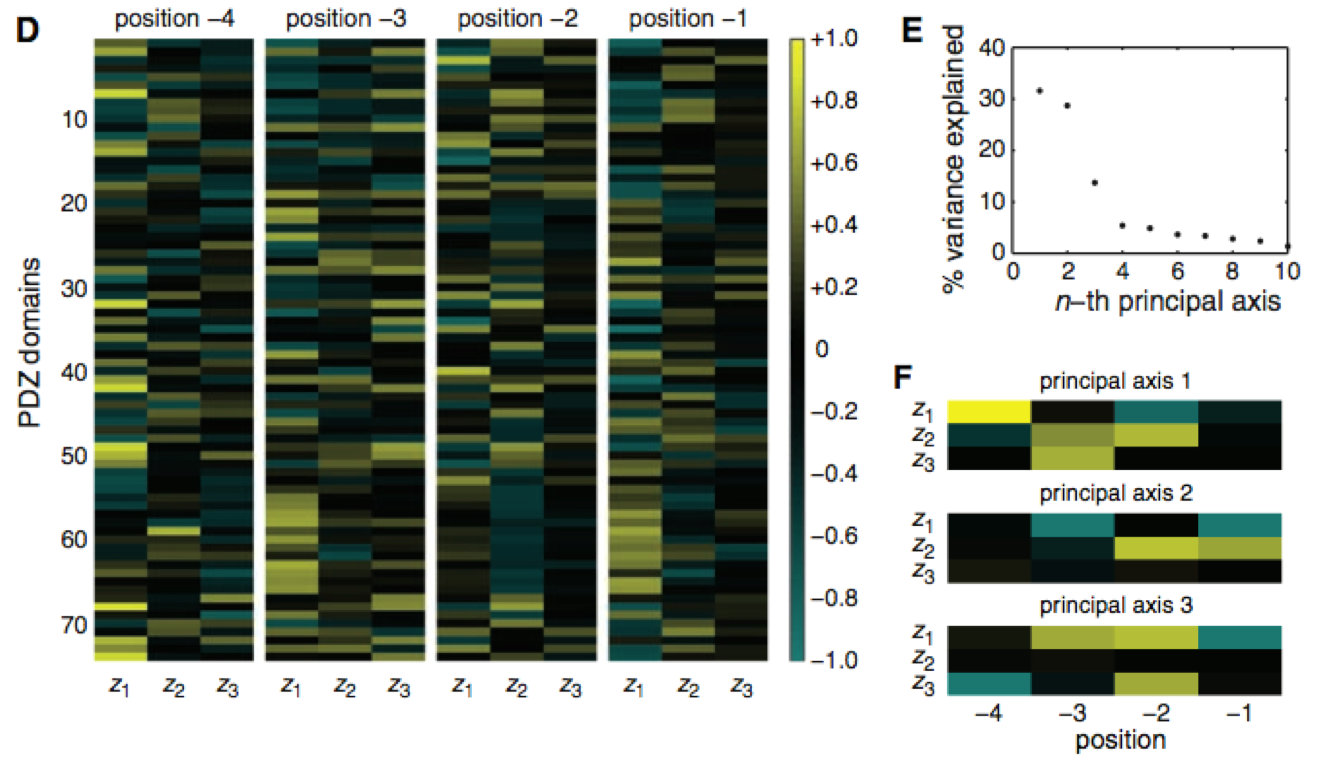
Figure 3, panel D is a matrix of correlational relationships among different PDZ domains, physiochemical properties (Z1-3), and four positions on the peptide ligands, with yellow representing a high correlation and light blue representing a negative correlation (black, neutral). This panel highlights the diversity of selectivity in relation to position and physiochemical property. The authors consider this evidence that the former three classes of PDZ binding are not specific enough to encapsulate all the interactive relationships present. Panel E shows that PDZ domain binding preferences depend on certain principal axes (x-axis), which, when plotted together, create what they call a "domain selectivity space." The y-axis is the percent of variance panel D's correlation matrix that can be explained by the axes, and therefore axes 1, 2, and 3 play the largest role in dictating the distribution of PDZ domain binding preferences. Panel F (the corrected version) provides a graph of these first three principal axes. The key aspect of this figure is that the selectivity varies within each axis according to both the physiochemical property (Z) and ligand position (-1 to -4). The authors take this as evidence that interactions all throughout the binding region influence selectivity (or binding preference), not just positions -2 and 0, as the literature had previously suggested.
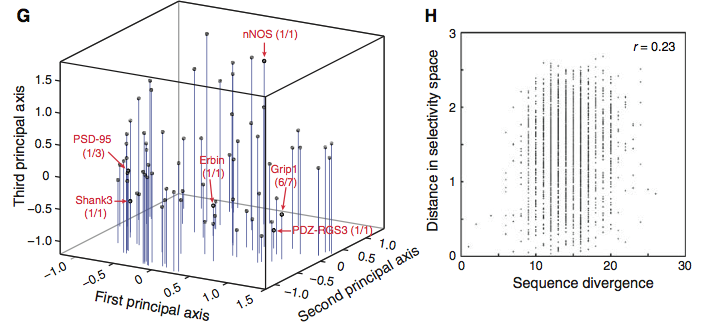
Figure 3, panel G shows the distribution of select PDZ domains (red terms) in the reserachers' coined "selectivity space," which is formed by the three principal axes (comprised of negative and positive values). Stiffler et al. report that these principal axes organize the PDZ domains into the three previously defined functional classes. For example, PSD-95 and Shank3 were two constituents of class I, thus showing that this class lies towards the more negative end of the first principal axis. The other classes fall in different regions of the space; class II domains (e.g., Grip1) lie more towards the positive end of the first principal axis, whereas class III domains (e.g., nNOS) fall within the positive region of the third principal axis. However, as the researchers emphasize, the distribution of PDZ domains is relatively even, offering evidence that PDZ domain binding selectivity lies on a continuum rather than solely within one of these three classes. Panel H compares the sequence divergence of different PDZ domains (x-axis) with their distance in selectivity space (y-axis). A weak r-value (correlation coefficient) of 0.23 suggests there is little correlation between a domain's overall sequence and its function. In other words, Stiffler et al. infer from this finding that PDZ domain binding selectivity is probably not dependent on (at least most of) the domain's sequence.
Next: Conclusions
![]()
Email questions or comments to kaswart@davidson.edu
© Copyright 2011 Department of Biology, Davidson College, Davidson, NC 28035