This web page was produced as an assignment for an undergraduate course at Davidson College.
Summary
The authors of the paper in question sequenced the genomes of 50 individuals (from two villages) of Tibetan origin and ancestry. Their goal was to find the genetic cause for the adaptiations to the hypoxic conditions associated with high altitude which are found in this population. These adaptations include birth weight, high hemoglobin levels, and blood oxygen saturation (both in infants and adults after excercise). Of particular interest in their findings was a particuar SNP located in the coding sequence for the protein EPAS1, which has been documented to be involved in regulation of blood oxygen concentration. Sequence alalysis of this region revealed that it was the most distinct region of the genome when compared to Han Chinese, based on PBS scores compared to a simulation. Furthermore, the SNP in question is approximately 78% more commonn in Tibetan populations relative to Han populations. This finding is significant not only due to the increased understanding of the mechanisms of altitude adaptations, but also due to its evolutionary implications. The Tibetans diverged from the Hans less than 3,000 years ago. If the authors' findings are correct, this could be the fastest yet known adaptation in a human population. The authors cite the lactase persistance adaptation in Northern European populations (which took approximately 7,500 years to reach its current frequency) as the fastest adaptation previously known. The possibilities of diversification at such high rates in such a short amount of time has serious implications for our understanding of human adaptability and recent evolutionary history. (Yi et al. 2010)
Figure Analysis
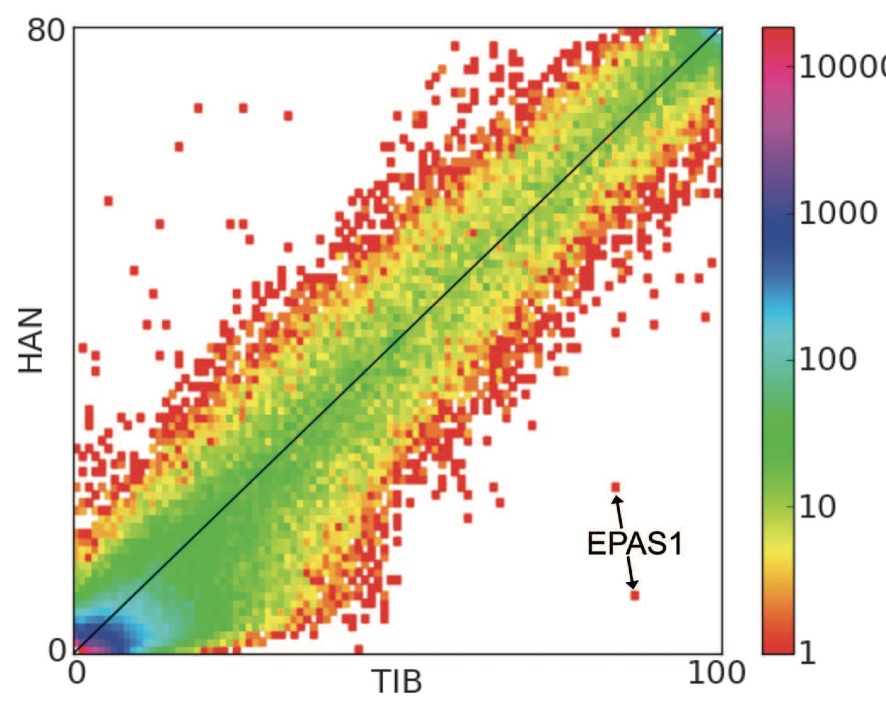
Figure 1. (Yi et al. 2010)
The authors describe this figure as a "site frequency spectrum." The frequency of a given SNP for a given population is given by the x (Tibetan) and y (Han) axes. The color represents the number of known variations of a given SNP according to the logarithmic scale illustrated by the vertical bar on the right. The locations of two variations of EPAS1 are shown by the labeled arrow. The most important point made by this figure is the dramatic difference in frequency of the two EPAS1 SNPs between the two populations. Both marked SNPs appear to occur at >80% in Tibetan populations, but at <20% (<10% in the case of the lower) in Han populations. It is important to note the difference in scale between the two axes. If the scale difference is considered, the relatively high frequency of the illustrated SNPs in the Tibetan population is even more apparent.
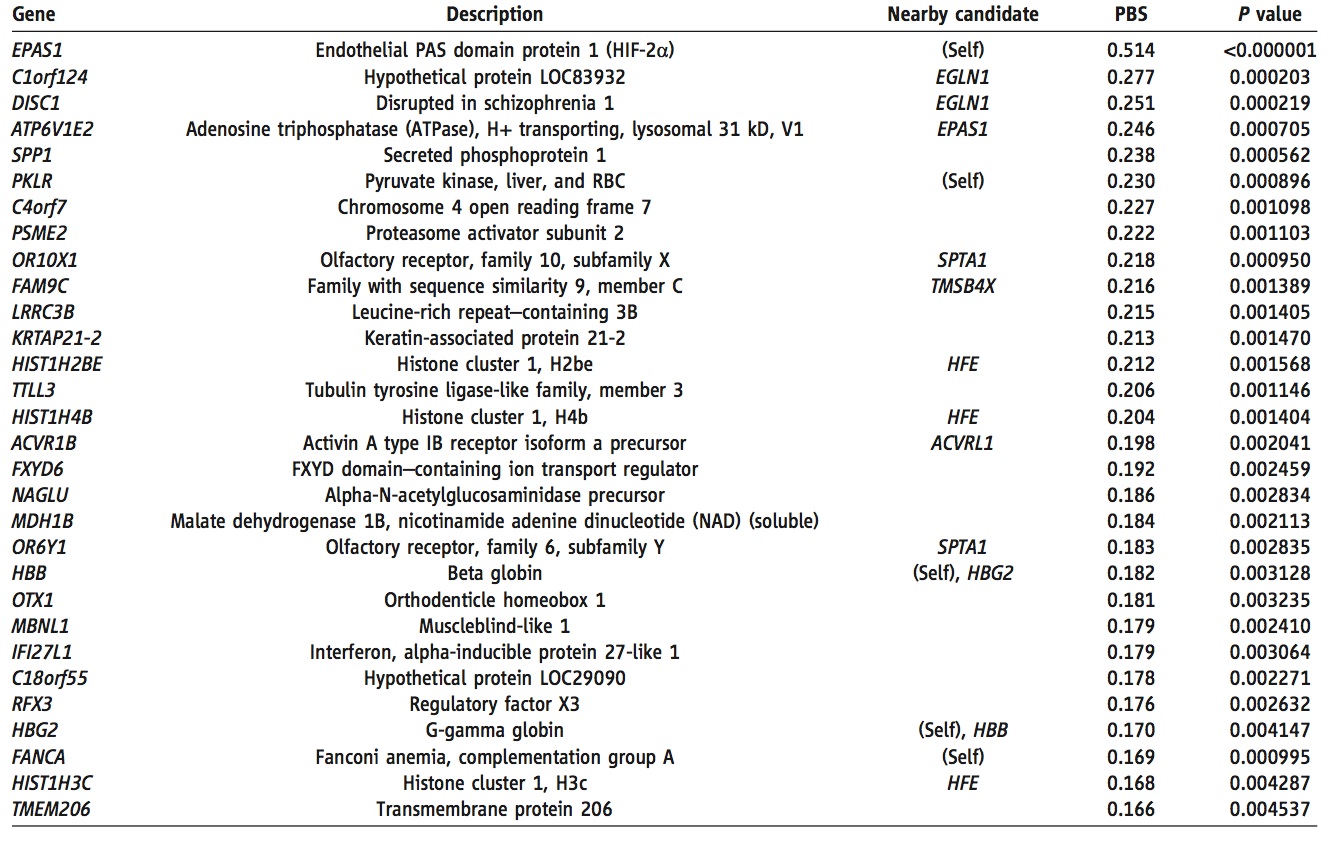
Figure 2. (Yi et al. 2010)
This table shows the 30 genes with the most increased frequency in the Tibetan population relative to the Han population. The "nearby candidate" column lists any other genes (or the gene itself) within 100kb which are known to be involved in oxygen regulation and response. PBS and P values for the Tibetan-Han comparison are also provided. The information provided in this table makes those genes which would be good candidates for altitude adaptation apparent. First of all, it is likely that any gene involved in such adaptation would have a relatively high PBS score, and therefore make this table. Secondly, one could potentially rule out those genes which are not in proximity to oxygen-related genes. By every criterion, EPAS1 is the clear frontrunner candidat. It's PBS score is ~1.9 times higher than the next highest gene (C1orf124). It is also directly involved in blood oxygen regulation. Furthermore, it is associated by location to the gene witht the fourth highest PBS score. Given this information, EPAS1 would be the obvious choice for further study.
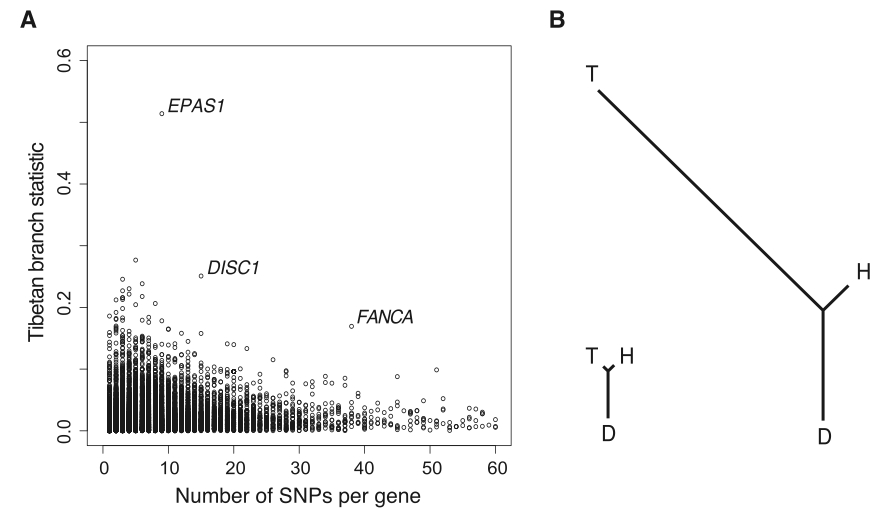
Figure 3. (Yi et al. 2010)
Panel (A) of this figure illustrates unique status of EPAS1 relative to the rest of the Tibetan genome. PBS scores are shown on the y-axis and the number of SNPs per gene is shown on the x-axis. As previously shown, EPAS1 is by far the most unique gene is the Tibetan genome. Panel (B) demonstrates the Fst-determined branch legth of Tibetan, Han, and Danish populations relative to each other. The tree on the left was generated by whole-genome comparison. It demonstrates the relatively close relationship between the Tibetan and Han populations, which is not surprising given their recent date of divergence. The relatedness illustrated here was the reason for which the authors chose the Han as their population against which to compare the Tibetans. Because the two populations are so closely related, one would expect their genomes to be relatively similar at most loci not subject to selection. This makes for an attractive study group as only those genes subject to selection should have particularly high divergence. The tree on the right is generated solely based on the EPAS1 gene. It is immediately apparent that this gene varies at a tremendously higher rate between the two Chinese populations. One should notice that the net branch length between the two lowland populations (Han and Danish) is considerably less than that between the two Chinese populations despite the vast geographic and temporal distance of the former pair and closeness of the later pair.
References