This web page was produced as an assignment for an undergraduate course at Davidson College
My Favorite Yeast Expression
The purpose of this page is to use microarray data to better understand the expression patterns of the annotated gene, MCA1, and the non-annotated gene, YOR193W.
When making microarrays, mRNA's must be converted into cDNA's at one point in the process so that the cDNA's can be put on the microarray chip for analysis. The nucleotides used to make the cDNA include either a green dye, Cy3, or a red dye, Cy5. Microarray data is a ratio between cells grown in two different conditions such as with oxygen or without oxygen. When the cDNA's bind to the expressed genes in question, expression is shown by this color continuum. Red means that the experimental condition was induced and green means that the experimental condition was repressed. It is important to understand this concept to analyze much of the data that will be displayed on this page.

Databases Searched
All of these databases were searched, but only the ones that provided interesting and pertinent information are shown on this page.
MCA1 - Annotated Gene
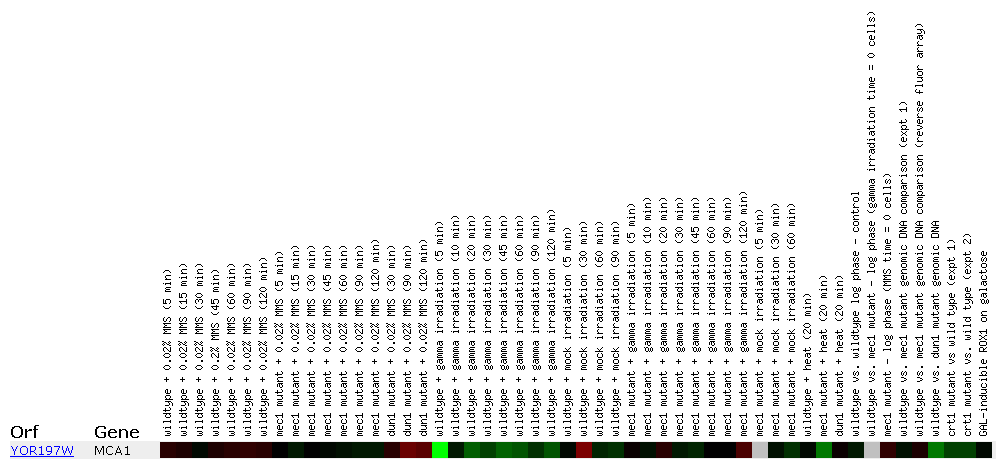
Expression in response to DNA-damaging agents MCA1/YOR197W:
Figure 1: This figure shows MCA1 expression when under different DNA-damaging experimental conditions. MCA1 is highly repressed at the "wildtype + gamma irradiation (5 min)" spot. It seems odd that there is such a severe level of repression when none of the other similar experimental conditions yielded similar results. There is possible another factor involved. Click on this image to find site.
Expression during the diauxic shift:
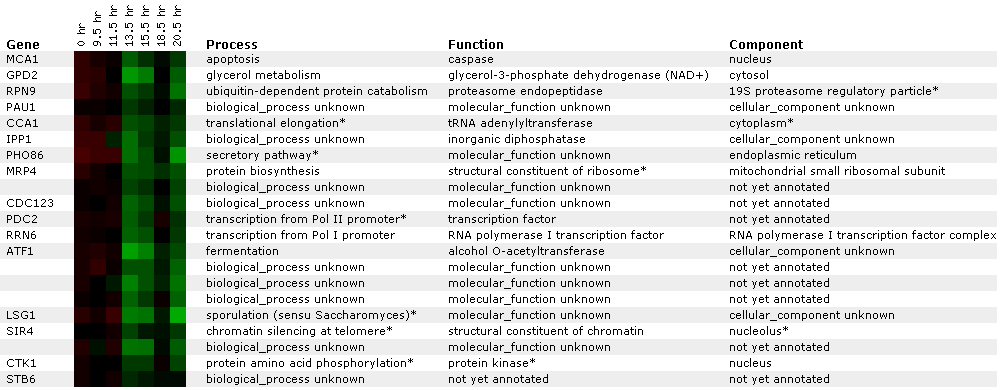
A diauxic shift is when an organism goes from a anaerobic environment to an aerobic one.
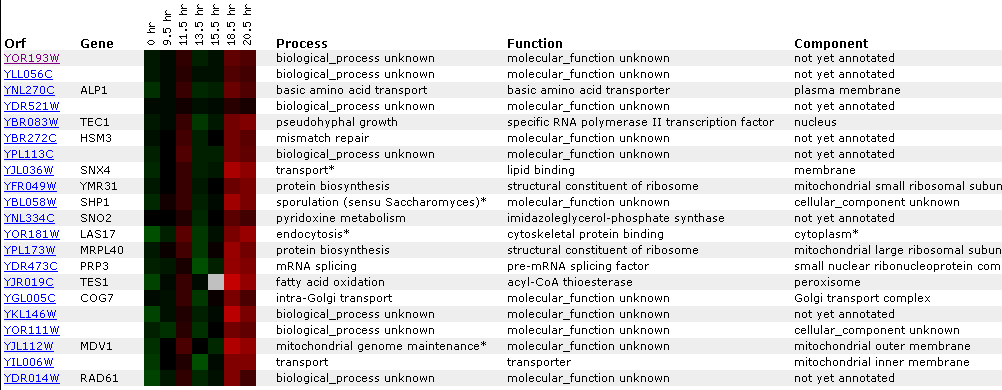
Figure 2: This figure shows microarray data for several genes including MCA1 at different stages in the diauxic shift. At the 13.5 hour some repression of MCA1 expression is indicated by the green shading. . Caspase, listed here as the function of MCA1, are molecules with a similar structure but are found in different species and are implicated in the processes of apoptosis. I wouldn't necessarily predict that a diauxic shift would alter gene expression in MCA1 but nonetheless some repression was shown. Click on this image to find page.
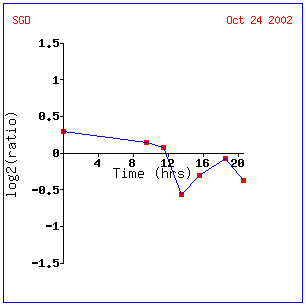
Figure 3: This graph describes expression ratio over time during a diauxic shift. This provides a bit more information than did the microarray data above and actually suggests that MCA1 is induced early on then repressed at different levels after 12 hours. Click on this image to find site.
Expression during sporulation:
Sporulation is the process by which diploid cells of budding yeast produce haploid cells. Click here to learn more about sporulation.
Figure 4: There is clearly a lot of repression in MCA1 as well as many of the related genes included in this figure. The fact genes contributing to apoptosis would be repressed during sporulation makes sense because spores are being made and the cell would be less likely to put energy into programmed cell death. Click on this image to find site.
Figure 5: This figure is a graphical description of the microarray data shown in Figure 4. Expression of MCA1 decreases drastically during sporulation. Click on the image to find page.
Expression during the cell cycle:
Figure 6: We would expect that apoptosis would not be occurring constantly throughout the life of a cell. Therefore, expression of genes involved in apoptosis would most likely have period of expression followed by periods of repression. In figure 6 we can see the peaks and troughs of gene expression over time during the yeast cell cycle. Unfortunately, time is not labeled on the x-axis so it's hard to tell when the peaks occur relative to the cell cycle. It's not certain, but one might assume that the vertical black bar might represent the ending and concurrent beginning of a cycle. In that case, this figure shows two full cell cycles. Click on this image to find site.
YOR193W - Non-annotated gene
Expression in response to histone depletion:
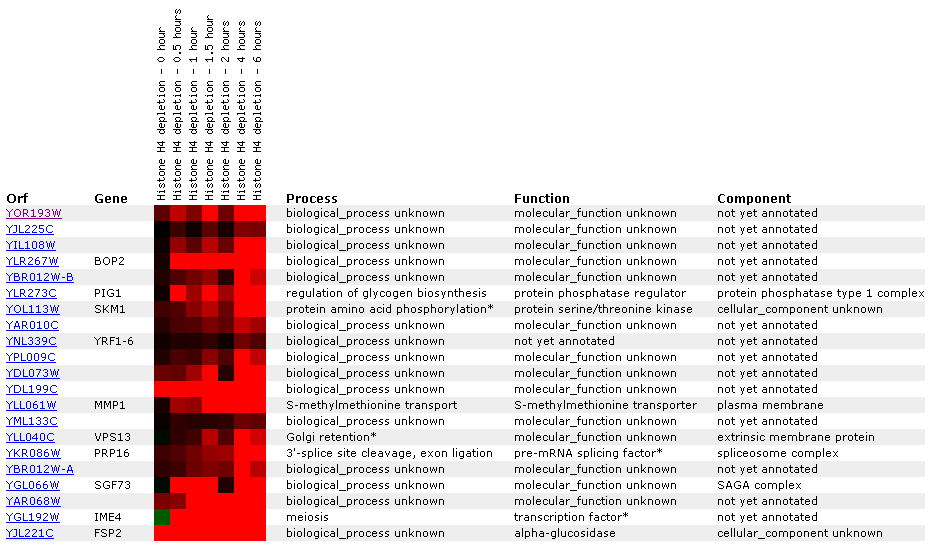
In this study nucleosomal histone's and silencing factors were depleted and the effects on the entire yeast genome, including YOR193W, were analyzed. They used a glucose shutdown system to stop Histone H4 transcription.
Figure 7: This microarray data shows that when histones are limited in the cell, YOR193W is induced. This is especially interesting because in hardly any of the experiments with MCA1 was there induction. This may lead us to believe that the two genes, while both involved in apoptosis regulation, perform opposite functions. Let's do more research before making any conclusions. Click on the image to find site.
Figure 8: This is the data displayed graphically. It shows a clear increase in transcription over time. Click on this image to find site.
Expression in response to varying Zinc levels:
Yeast grown in varying Zinc concentrations were compared with yeast grown in a 3mM solution.
Figure 9: In this experiment, ratios between different concentrations of zinc in wildtypes as well as in Zap1p mutant strains were tested. The zap1p transcription factor senses cellular zinc status and increases expression of its target genes in response to zinc deficiency (Lyons et al. 2000). If YOR193W were a target gene for responding to zinc deficiencies, you would expect a significant increase in expression levels in zap1p mutants. Here there were no major changes in transcription indicating that the gene has some other function most likely involved in apoptosis like its neighbor MCA1.
Expression during the diauxic shift:
A diauxic shift is when an organism goes from a anaerobic environment to an aerobic one.
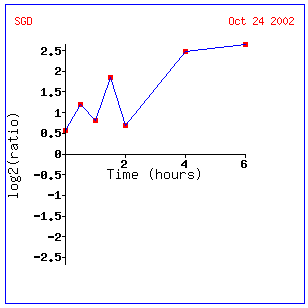
Figure 9: The expression in this experiment is not prolific but the YOR193W gene is induced a slight amount. This is interesting only when compared to expression patters of MCA1 in the same conditions. MCA1 is slight repressed whereas YOR193W is slightly induced. Assuming that YOR193W is involved in apoptosis because of its proximity to MCA1 on the chromosome, this data is curious. One explanation might be that MCA is some sort of positive regulator of apoptosis and YOR193W is a repressor. Click on the image to find the site.
Conclusion: Microarrays are indeed amazing tools for analyzing genes. In this analysis, there has been evidence to confirm some of the things that we predicted about MCA1 and YOR193W and evidence that provides new insight into the function of these neighboring genes. The fluctuation of MCA1 during the cell cycle supports the argument that the gene is involved in apoptosis. Also, new evidence showing that YOR193W is induced under the same conditions that MCA1 is repressed suggests that the two genes may function in different ways while still regulating the same process. As our understanding of genes and genome interaction improve, microarrays will continue to be more and more valuable research tools. It is imperative that scientists continue to think of novel ways to use microarray data to describe gene activity. Maybe one day, microarray analysis will allow us to diagnose illnesses or even predict moods just by analyzing the genes that are being expressed!
References
Expression Connection (2002). <http://genome-www4.stanford.edu/cgi-bin/SGD/expression/expressionConnection.pl>
Lyons, T. J. et al. (July, 2000) Genome-wide charactorization of the Zap1p zinc-responsive regulon in yeast. PNAS97, 14: 7956-7962.
The transcriptional program of sporulation in budding yeast (2002). <http://cmgm.stanford.edu/pbrown/sporulation/index.html>
This page was designed by Graham Watson, a senior Biology major at Davidson College.
Click here to go back to my Home Page
© Copyright 2003 Department of Biology, Davidson College, Davidson, NC 28035
Send question to grwatson@davidson.edu
