
In this web page, I explore the expression patterns of my two favorite Saccharomyces cerevisiae genes - the annotated gene PCP1 and the nearby non-annotated gene YGR102C. DNA microarrays, which can simultaneously measure the transcription level of every gene in a genome, enable us to investigate expression patterns. Information available at the following public databases will be used to analyze the two genes:
Function Junction searches functional analysis project sites for all the available information pertaining to any given gene or ORF.
Expression Connection, a part of the Saccharomyces Genome Database, supplies gene expression data obtained from multiple microarray studies, for every yeast gene.
The following red-green color scale is used to represent gene induction and repression. If a gene is induced (stimulated to produce more mRNA) it is given in a red color for that time point. On the other hand, if a gene is repressed (transcribed less) it is given in a green color for that time point. If there is no change in the transcription level between control and experimental conditions (mRNA ratio of 1:1), the gene is given in a black color for that time point.

Figure 1: Red-green color scale for changes in transcription.
The systematic name for PCP1 is YGR101W. On a previous course web page, I had found the following gene ontology information about PCP1.
Molecular function: peptidase activity i.e. catalysis of the hydrolysis of peptide bonds.
Biological process: mitochondrial intermembrane space protein import; mitochondrion organization and biogenesis.
Cellular component: mitochondrion (in the mitochondrial inner membrane).
Yeast Pathcalling is one of the resources available at this database. The figure below shows YGR101W has no known interactions with any other genes.
Figure 2: No interactions for YGR101W (Function Junction, 2003; <http://db.yeastgenome.org/cgi-bin/SGD/functionJunction>).
The Yeast Microarray Global Viewer is another resource. Results of the PCP1 query are displayed as one histogram per publication. Each bar represents the log2(ratio) of gene expression in an experiment. If selected gene is induced it is in red and if repressed (negative ratio) it is in green. (Function Junction, 2003; <http://db.yeastgenome.org/cgi-bin/SGD/functionJunction>).
In particular, let's view the box for the Jelinski Rpn4 and Yale salt.
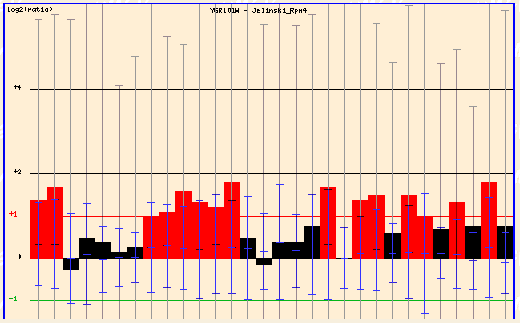
Figure 3: Jelinski Rpn4 (Function Junction, 2003; <click here>).
In the Jelinski Rpn4 experiment, the cells were damaged and PCP1 showed strong fold induction.
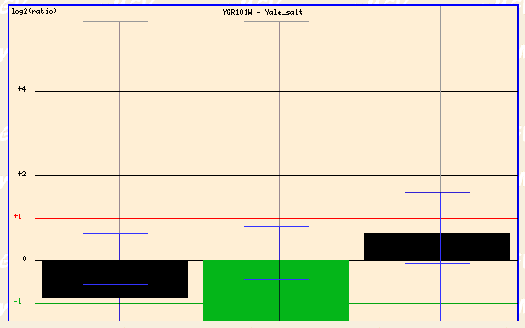
Figure 4: Yale salt (Function Junction, 2003; <click here>).
In the Yale salt experiment, the cells were subjected to high salinty and PCP1 was repressed.
This database supplies us with gene expression data for PCP1 obtained from multiple microarray studies.

Figure 5: Up to 20 similar genes are shown, with a Pearson correlation of > 0.8 to PCP1.
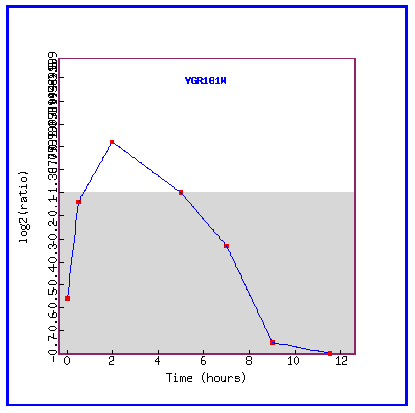
Figure 6: Expression during sporulation
During sporulation, PCP1 is progressively repressed.

Figure 7: There were no genes in this dataset with a Pearson correlation > 0.8 to the expression profile of PCP1.
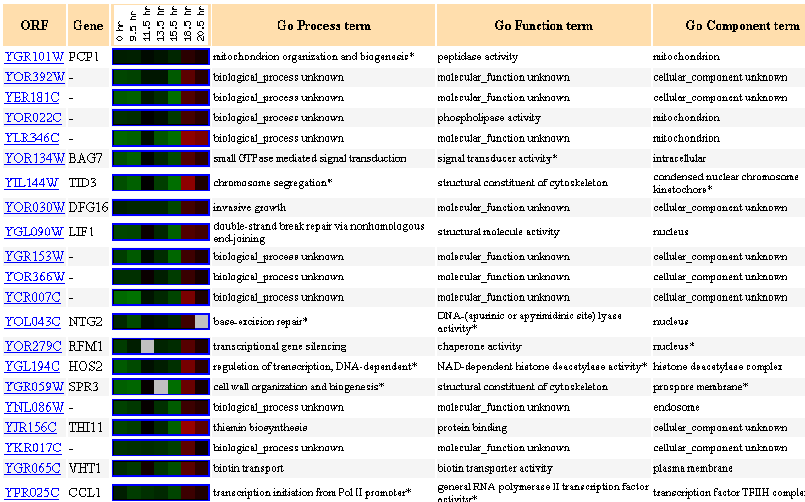
Figure 8: Up to 20 similar genes are shown, with a Pearson correlation of > 0.8 to PCP1.
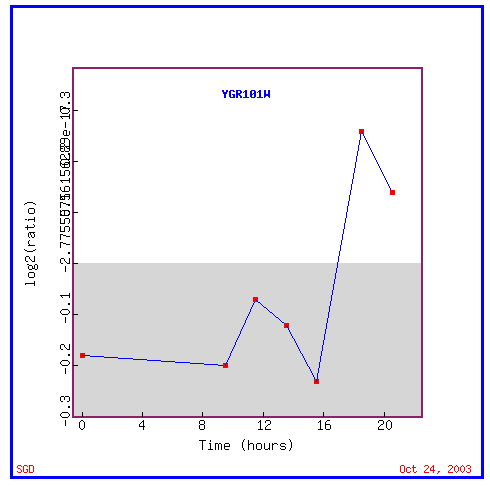
Figure 9: Expression during the diauxic shift
During the diauxic shift, PCP1 is initially repressed and then suddenly highly induced.
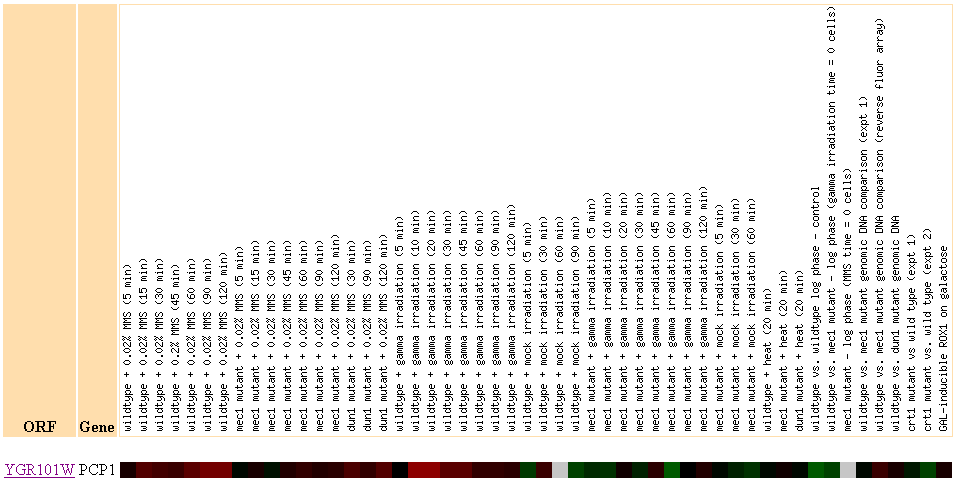
Figure 10: There were no genes in this dataset with a Pearson correlation > 0.8 to the expression profile of PCP1.
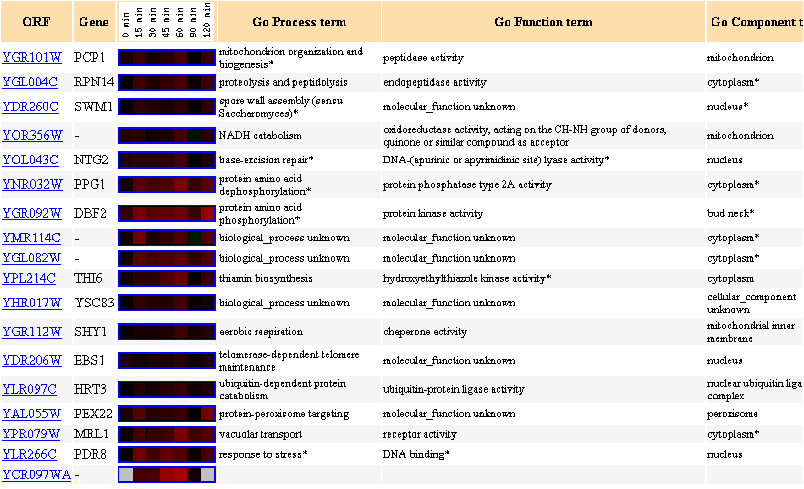
Figure 11: Up to 20 similar genes are shown, with a Pearson correlation of > 0.8 to PCP1.
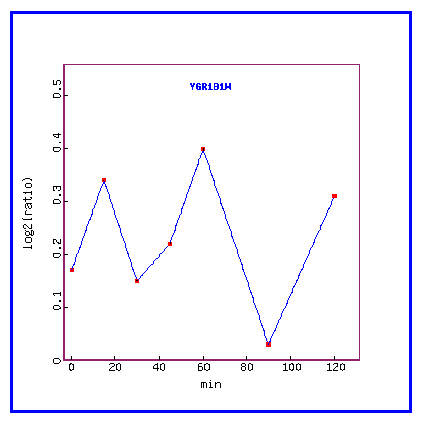
Figure 12: Expression in response to alpha-factor (over time)
Over time, in response to the alpha factor, PCP1 is always induced.
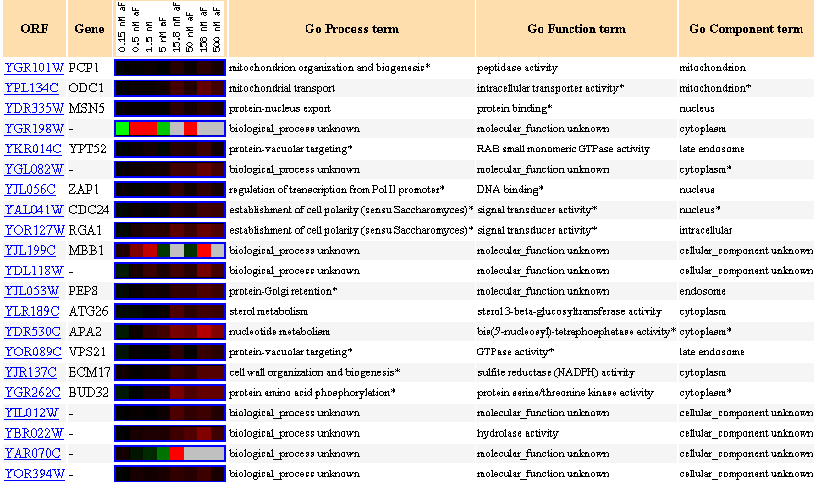
Figure 13: Up to 20 similar genes are shown, with a Pearson correlation of > 0.8 to PCP1.
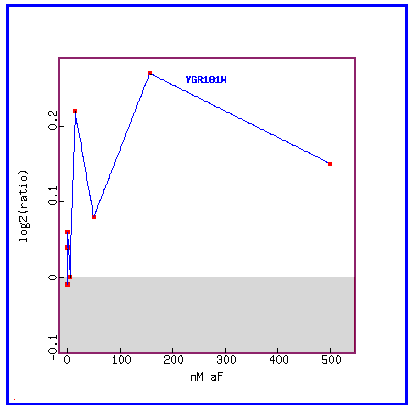
Figure 14: Expression in response to alpha-factor (various concentrations)
In response to various concentrations of the alpha factor, we see that PCP1 is always induced.
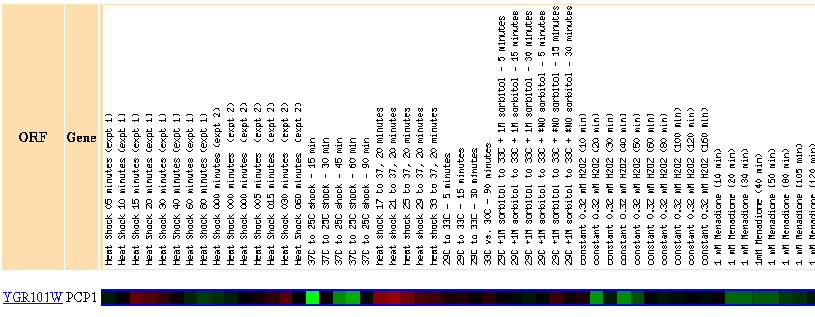
Figure 15: There were no genes in this dataset with a Pearson correlation > 0.8 to the expression profile of PCP1.
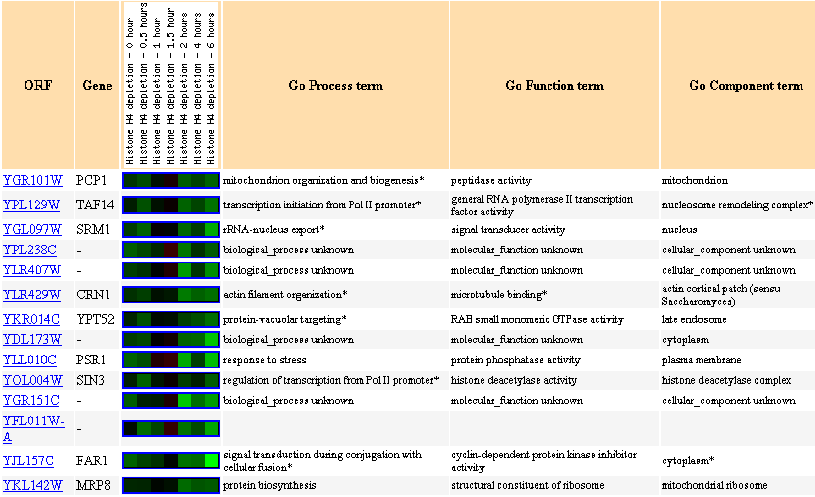
Figure 16: Similar genes are shown, with a Pearson correlation of > 0.8 to PCP1.
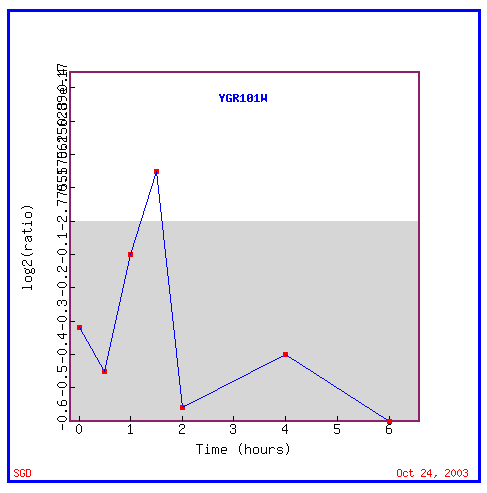
Figure 17: Expression in response to histone depletion
In response to histone depletion, PCP1 is almost always repressed.
Conclusion:
Under conditions like sporulation, the initial part of the diauxic shift and histone depletion, PCP1 is repressed. However, in response to a mating factor, the gene is always induced. This fits in with the known information about PCP1. Since it is required for the maintenance of mitochondrial morphology and mitochondrial DNA, it is induced during mating.
Hence, after studying PCP1 using online microarray databases, we have confirmed the role of the gene in mitochondrion organization and biogenesis.
The figure below, obtained from Yeast Pathcalling shows that YGR102C has no known interactions with any other genes.
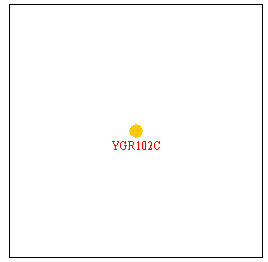
Figure 18: No interactions for YGR102C (Function Junction, 2003; <http://db.yeastgenome.org/cgi-bin/SGD/functionJunction>).
This database supplies us with gene expression data for YGR102C obtained from multiple microarray studies.
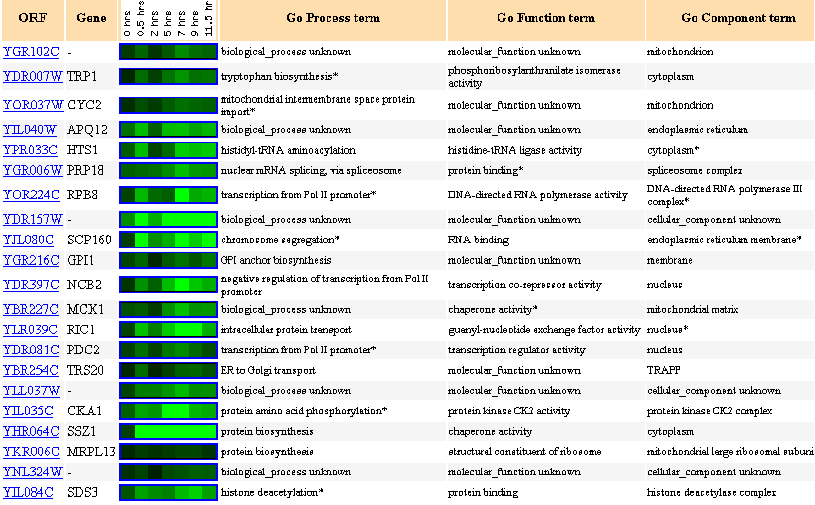
Figure 19: Up to 20 similar genes are shown, with a Pearson correlation of > 0.8 to YGR102C.
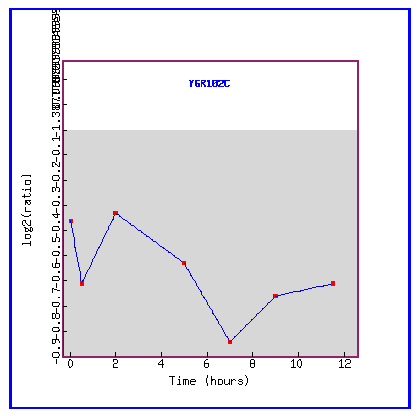
Figure 20: Expression during sporulation.
During sporulation, the gene YGR102C is always repressed.

Figure 21: There were no genes in this dataset with a Pearson correlation > 0.8 to the expression profile of YGR102C.
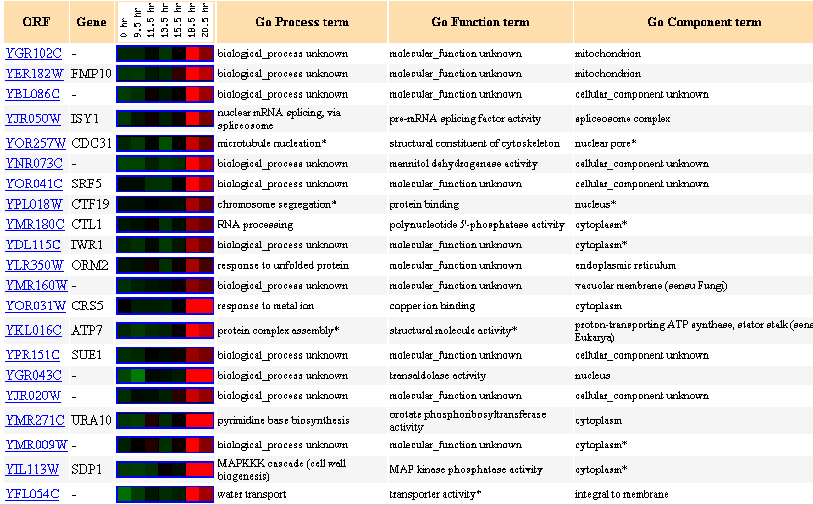
Figure 22: Up to 20 similar genes are shown, with a Pearson correlation of > 0.8 to YGR102C.
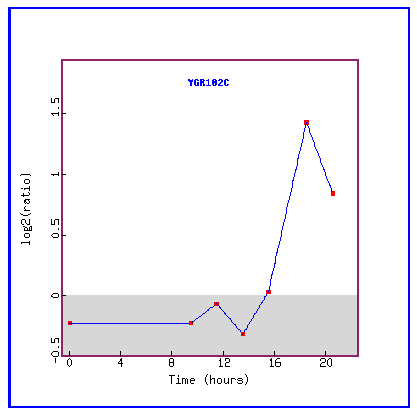
Figure 23: Expression during the diauxic shift.
During the diauxic shift, YGR102C is initially repressed and then suddenly highly induced.
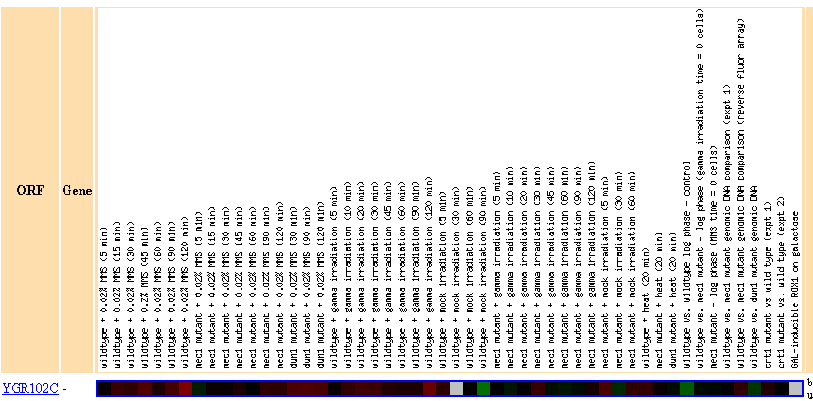
Figure 24: There were no genes in this dataset with a Pearson correlation > 0.8 to the expression profile of YGR102C.
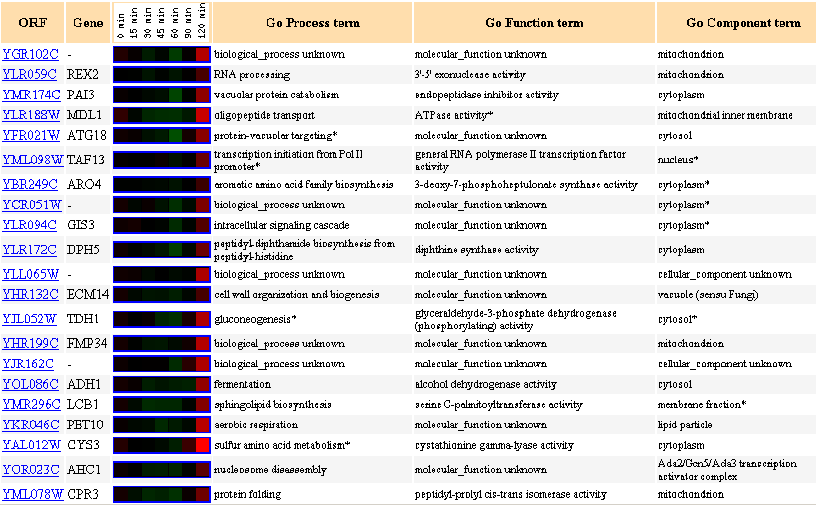
Figure 25: Up to 20 similar genes are shown, with a Pearson correlation of > 0.8 to YGR102C.
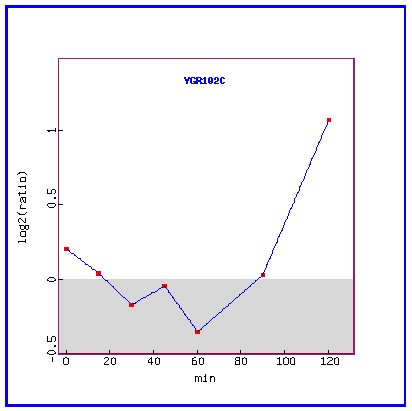
Figure 26: Expression in response to alpha-factor (over time).
Over time, in response to the mating factor, YGR102C is initially repressed and then highly induced.
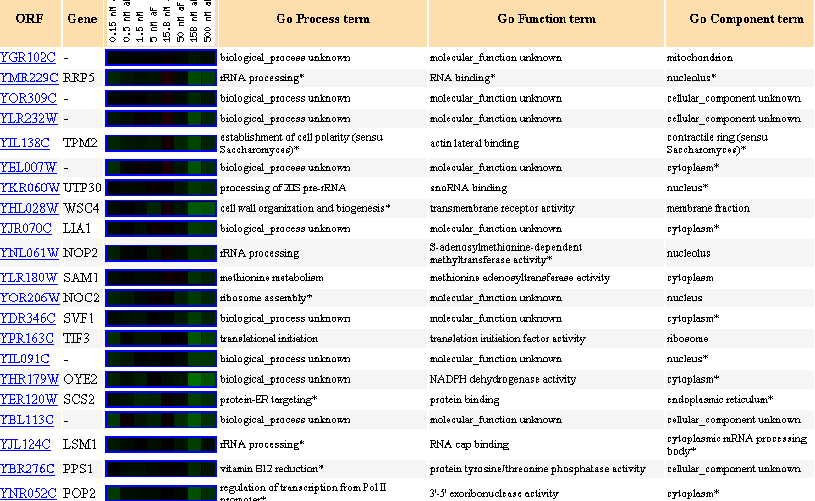
Figure 27: Up to 20 similar genes are shown, with a Pearson correlation of > 0.8 to YGR102C.
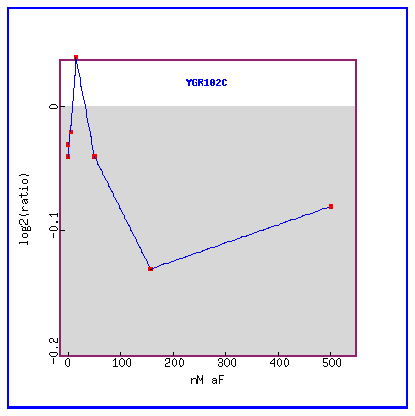
Figure 28: Expression in response to alpha-factor various concentrations.
YGR102C is initially slightly induced and then only repressed.
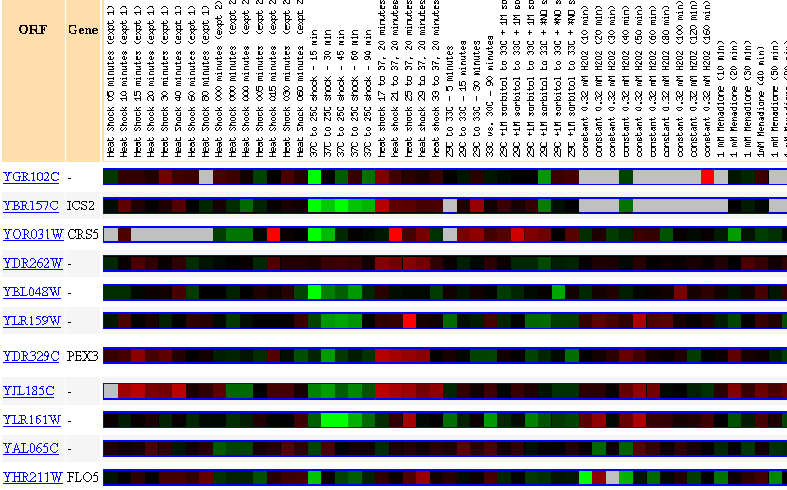
Figure 29: Up to 20 similar genes are shown, with a Pearson correlation of > 0.8 to YGR102C.
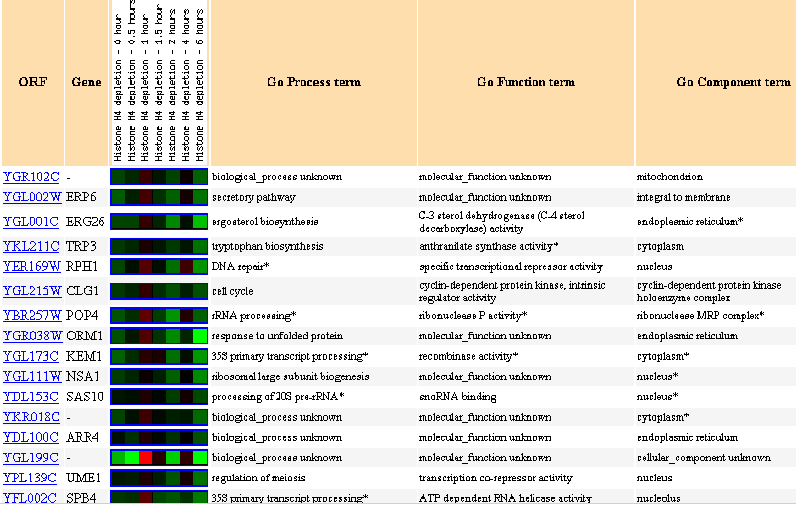
Figure 30: Up to 20 similar genes are shown, with a Pearson correlation of > 0.8 to YGR102C.
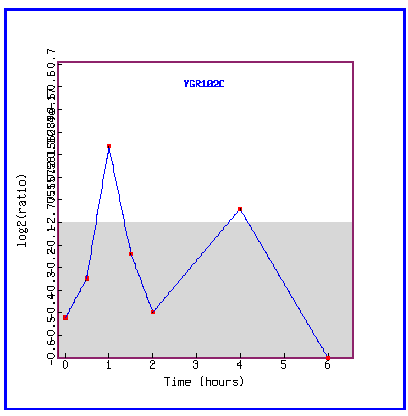
Figure 31: Expression in response to histone depletion.
YGR102C is mostly repressed during histone depletion.
Conclusion:
Thus, public online database searches help us to study the non-annotated gene YGR102C. Except in response to environmental changes, and towards the end of the diauxic shift, the gene is almost always repressed. During the searches, the expression profiles of YGR102C correlated mostly with genes whose biological processes are as yet unknown. But a number of the similarly expressed genes were involved in rRNA processing. Perhaps YGR102C is also required for the formation of ribosomes.
On my previous web page, I had predicted that YGR102C must be a nucleolar protein involved in rRNA processing. Thus the predictions are consistent with what we've determined using the databases.
Send questions, comments and suggestions to: pakarnik@davidson.edu