This web page was produced as an assignment for an undergraduate
course at Davidson College.
The Expression Patterns of GPA1 and YHR003C
On a previous page, I described the known gene GPA1 and analyzed information about its non-annotated neighbor YHR003C. An analysis of the expression patterns of these two genes can provide more information about the known gene and help to refine the hypothesis of function for the unknown gene. DNA microarrays are the most common method of high throughput analysis of gene expression. Each piece of expression data discussed in this webpage was obtained with the use of DNA microarrays. An animation which provides more information about DNA microarray methodology can be found at this website- Microarray Animation.
General Expression Data Analysis Information
The colors corresponding to gene induction and repression that will be used in the figures on this page is shown below:
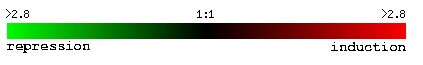
Image from: http://genome-www4.Stanford.EDU/cgi-bin/SGD/expression/expressionConnection.pl
The expression data reviewed on this page can be found at the following sources:
Expression Connection- This website, as a part of the Saccharomyces Genome Database, provides gene expression information about any gene in the yeast genome for 11 different experiments. The genes may be compared to other similarly expressed genes.
Function Junction- Also a part of SGD, this website compiles information about genes from many different sources. Included in this information are summaries of gene expression from many experiments.
Webminer- This database, also linked to SGD, gives an alternative searching method for expression data. Data may be seen for all the genes in the yeast genome with certain expression patterns in chosen experiments.
Review of GPA1 Function
As noted in my webpage detailing the GPA1 gene and the role of its protein product in Saccharomyces cerevisiae, GPA is active in the mating signal transduction pathway in yeast in the following ways:
- GPA1 acts as the alpha subunit of the heterotrimeric G protein involved in the mating cascade.
- This alpha subunit interacts with integral membrane mating pheromone receptors.
- When stimulated by a mating pheromone, GPA1 releases the beta and gamma subunits of the G protein to initiate the signaling cascade that leads to cellular differentiation, cell cycle arrest and the formation of an oblong cell shape called a "shmoo."
- GPA1 itself appears to play an inhibitory role in the mating response, allowing cells to adapt to the mating signal and resume the cell cycle if no fusion occurs.
GPA1 Expression Data Analysis
Expression During Mating Events
GPA1 is known to be involved in the yeast pheromone response pathway, so data detailing the expression of GPA1 under alpha-factor stimulation would be expected to give biologically significant results.
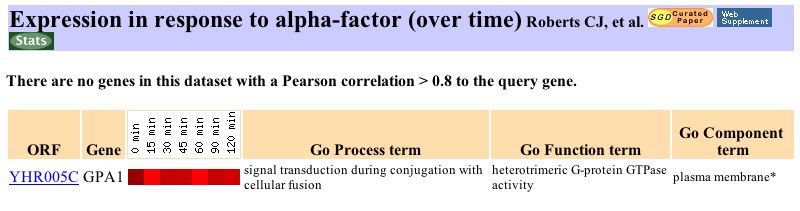
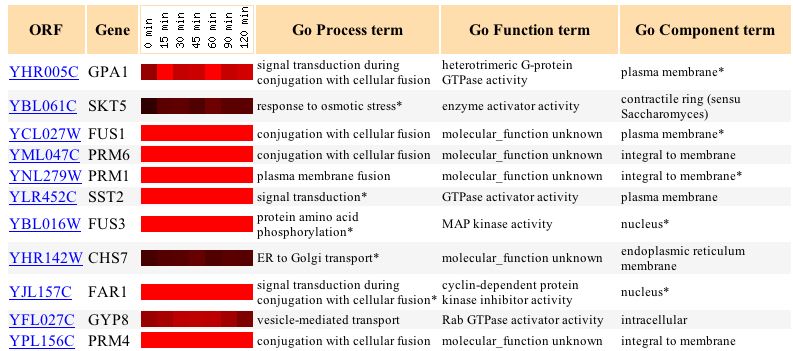
The bright red shown in the image above from Expression Connection shows that, as expected, GPA1 was induced a maximum of 2.8 fold in response to alpha factor over time. Expression Connection also shows genes with a correlation coefficient of 0.8 or higher to this expression pattern. As expected, the figure below shows that many genes that cluster with GPA1 are also involved in the mating signal transduction pathway (Such as FAR1, FUS1, PRM4, and PRM6). This information supports the validity of the "guilt by association" method of determining gene function- GPA1 clusters with genes that function in a similar pathway.
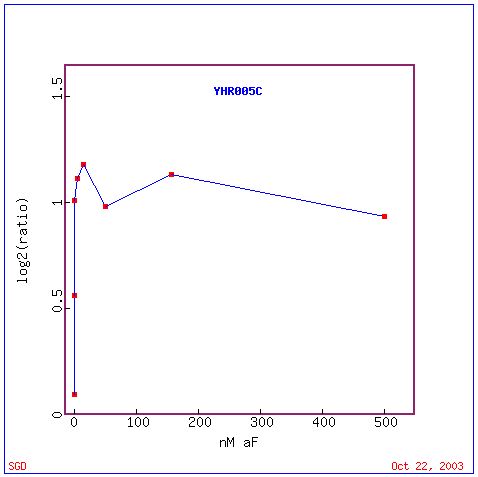
The graph below shows that, in response to various concentrations of alpha factor, the expression of GPA1 was seen to increase to a certain level and then essentially level off. This is the expected response for a protein that is coupled to the alpha factor receptor in yeast cells.
Since GPA1 is known to be involved in both the mating pheromone signaling pathways for both "a" and alpha cells, it would be expected that a similar induction of GPA1 would be seen under "a" factor stimulation. The Webminer database of expression experiments gives data for an "a" factor stimulation experiment. As expected, GPA1 experiences a 2.03 fold induction.
Webminer also contains expression data for experiments in which the other two subunits of the heterotrimeric G protein were deleted. When the beta subunit, STE4, was deleted, the ratio of GPA1 in the deleted strain vs. wild type was 0.35, corresponding to a 2.8 fold repression. Similarly, when the gamma subunit, STE18, was deleted, the ratio of GPA1 expression to wild type was 0.28- a 3.6 fold repression. The fact that GPA1 is repressed when the other subunits of its G protein are repressed may indicate the cell's attempt to balance the signaling pathway. The mating pathway activating subunits are not present, so the mating pathway inbiting subunit, GPA1, is downregulated in an attempt to compensate.
Expression During Other Environmental Conditions
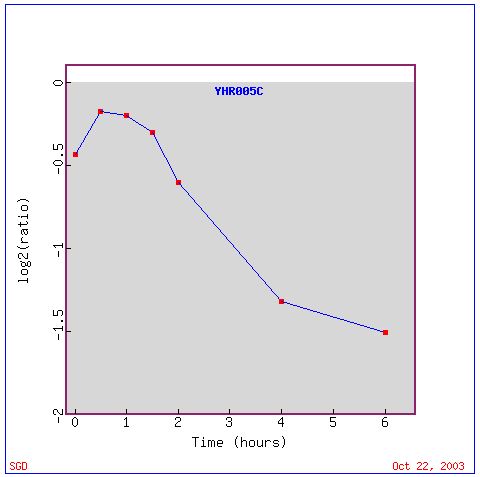
Of the expression data presented at Expression Connection, GPA1 shows the least change in expression (max induction = 1.2, max repression = -1.4) during the diauxic shift, as shown in the image below:
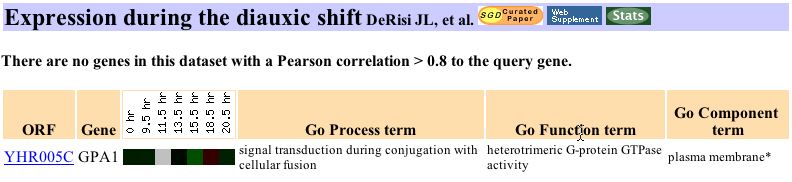
According to the researchers who performed this glucose limiting experiment, genes involved in protein synthesis were typically repressed in response to the diauxic shift, while those involved in energy metabolism were induced (DeRisi, et. al., 1997). As a signaling protein active in the mating pathway, GPA1 performs neither the greatly energy demanding functions of protein synthesis, nor the functions of energy metabolism, so it is understandable that this gene would show little change in expression during the diauxic shift.
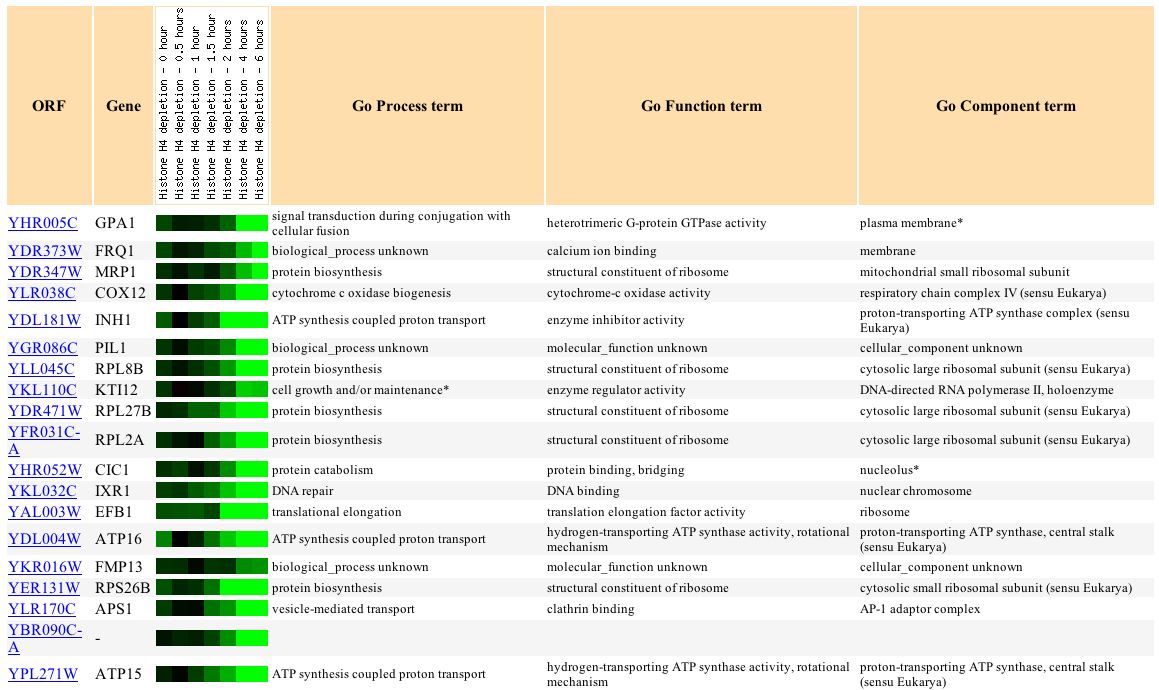
An interesting pattern of GPA1 expression found on Expression Connection is seen during histone depletion. Depletion of histones decreases the nucleosome content of the cell. Since nucleosomes are used to package the genome and thus often repress expression, it might be expected that genes would be induced as a result of this experiment. However, the researchers found that the effect of histones on gene expression is gene specific, and some genes, including GPA1, were repressed (Wyrick, et.al., 1999). As shown in the figure below, GPA1 is steadily repressed over time during this experiment.
This pattern of repression in GPA1 is similar to the pattern of expression for several other genes as shown in the figure below:
The biological functions of this group of clustered genes can be analyzed for significant patterns using the Gene Ontology Term Finder function <http://db.yeastgenome.org/cgi-bin/SGD/GO/goTermFinder> This analysis compares the frequency of a particular biological process, function, or cellular component term among the cluster with the overall frequency of this term in the genome. The P-value indicates the significance of these findings (a smaller P-value corresponds to greater significance) . As shown in the image below, this analysis shows that a significant proportion of the genes that behave similarly to GPA1 during histone depletion are involved in nucleotide triphosphate synthesis or metabolism. As a protein known to be involved in GTPase activity, the clustering of GPA1 with proteins involved in ATP metabolism is reasonable and biologically significant.
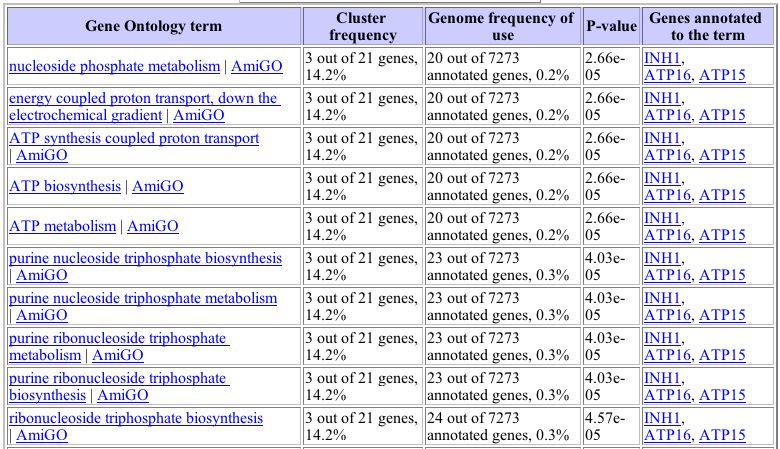
Image from: http://db.yeastgenome.org/cgi-bin/SGD/GO/goTermFinder
The largest repression or induction value of GPA1 for any dataset on Expression Connection is seen during the environmental shocks. A repression of -9.1 is seen during the progression to stationary phase as shown below. (Gasch, et. al. 2000).
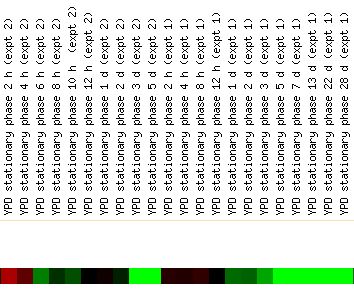
Since stationary phase is defined as the phase of yeast growth at which there is no net increase in cell number, the repression of GPA1 during this phase of yeast existance suggests that GPA1 is not necessary for the maintenance of cell life without excessive proliferation. This is consistent with GPA1 as a mating signal transducer. When the cell is simply maintaining a constant population, this type of response is not needed. (Braun, et. al., 1996).
Some significant initial repression of GPA1 is also seen during the heat shock and hydrogen peroxide exposure over time experiments (Gasch, et al., 2000).

This result places GPA1 in the large category of genes that are repressed initially and then adapt to stresses as a part of the environmental stress response (ESR). Genes that cluster with this gene in expression pattern are involved in biosynthesis, which places GPA1 in the first category of repressed genes outlined by the researchers who performed these experiments. GPA1 is thus associated with and apparently coregulated with proteins involved in growth-related processes (Gasch, et. al., 2000). This result is not intuitively expected for a protein involved in the mating pathway and not stress responses. Since GPA1 has recently been found to assist the yeast cell's return to the normal cell cycle after transmitting the initial mating signal, it could be hypothesized that GPA1 plays a role in supressing general abnormal cellular reactions such as the stress response, and it must be inhibited in order to allow the cell to respond to heat or hydrogen peroxide. Alternatively, the cell may repress the expression of genes unneccessary to cell survival (such as those involved in the mating pathway along with other growth genes) when a strong environmental stress is present.
Overall, these data sets for the expression patterns of GPA1 confirm previously known information about the gene and its role in the life of yeast. In some cases, the significance of the data is less obvious, and new hypotheses must be formed.
Review of YHR003C Function Prediction
In a previous webpage, the conserved domains, protein interactions, and homologs of YHR003C were considered and the following information was gleaned:
- YHR003C shows much homology to dinucleotide-utilizing enzymes that are involved in molybdopterin and thiamine biosynthesis.
- YHR003C contains conserved ThiF domains that, in other proteins allow function in mRNA binding or mitochondrial protein transport.
- This protein appears to be globular.
From this information, I previously predicted that YHR003C was a globular protein which functions as an enzyme. It may have catalytic activity involving nucleotide binding and be active in pathways involving biosynthesis.
YHR003C Expression Data Analysis
Data from the gene expression sites listed earlier in the webpage may be used to analyze the repression or induction of the non-annotated gene YHR003C under various conditions. By examining patterns of expression and genes that cluster with YHR003C in their expression patterns, a better hypothesis for the function of YHR003C in the life of yeast may be determined.
In general, it can be noted that this gene is not repressed or induced as strongly or as often as is GPA1 in the particular experiments included in Expression Connection and Function Junction. This is shown clearly in the statistics from Function Junction below:
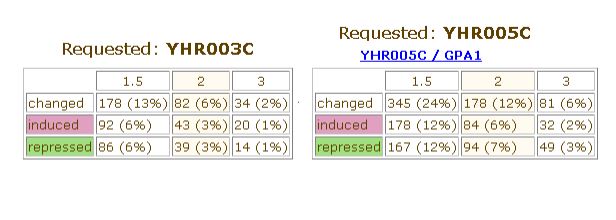
Image from: http://db.yeastgenome.org/cgi-bin/SGD/functionJunction
This information might indicate that the expression of YHR003C is needed constitutively and thus is not as variable in response to experimental changes as a gene like GPA1, whose protein product is necessary only in the mating response pathway.
Experiments showing little significant change in expression
Experiments that produce little or no change in the expression of a gene can reveal important information about its function. In the information contained at Expression Connection, the smallest change in expression of YHR003C occurs in the exposure to alpha factor experiment as shown below.
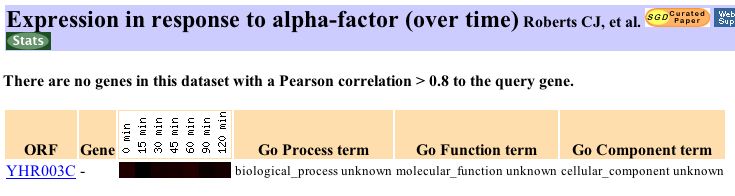
The gene shows no repression during exposure to alpha factor and has a maximum induction of 1.1 (barely noticeable red color in the figure). This information suggests that YHR003C, unlike is close neighbor GPA1, is not a protein involved in the alpha factor mating response pathway (Roberts, et.al., 2000).
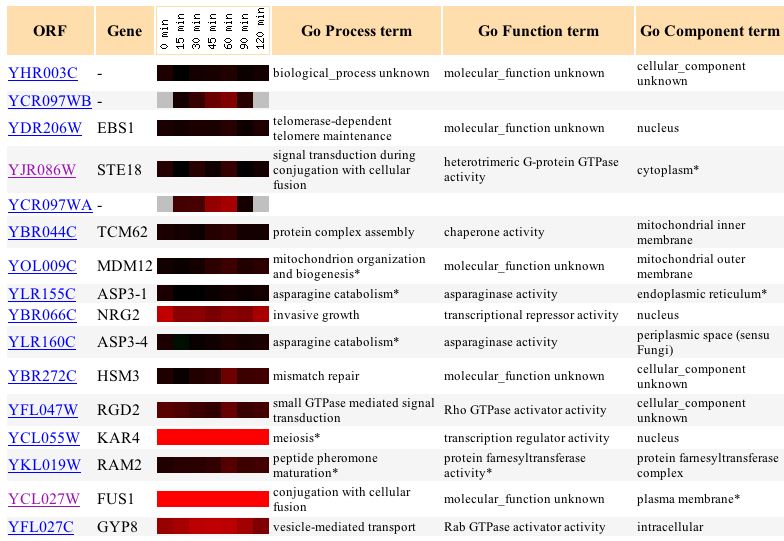
Examination of genes clustered with this gene for this data set introduces an important caveat to the significance of this type of analysis. The gene FUS1, (highlighted purple in the figure below) which is involved in the mating pathway, is clustered with this unknown gene. With this knowledge alone, it might appear that YHR003C is involved in the mating pathway. However, the clustering is based on the correlations of the general expression trends, not their magnitudes. (Campbell et.al., 2003) Thus, the fact that YHR003C appears to be very slightly induced during the initial exposure to alpha factor causes it to have a reasonably high correlation with FUS1, which is very highly induced during the exposure to alpha factor. STE18, the gamma subunit of the heterotrimeric G protein with which GPA1 is associated, is also seen in this cluster, but it is not highly induced in response to alpha factor. This is likely because STE18 must be present at all times to receive a mating stimulus so that it can affect the expression of other genes like FUS1. Thus, it cannot be conclusively said that YHR003C is not involved in the mating pathway, only that it does not appear to be a protein that specifically becomes active as a response to the alpha factor stimulus in the processes of cellular differentiation and shmoo formation.
YHR003C also shows very little change in expression after evolution during glucose limitation as seen below:
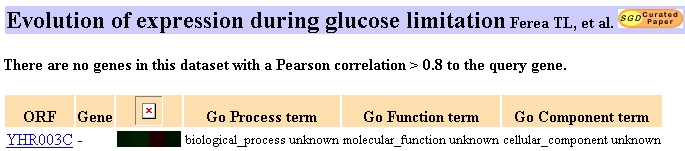
The maximum and minimum values of the induction and repression are 1.1 and -1.1 respectively. In the paper concerning this expression experiment, the authors indicate that genes exhibiting altered expression in strains that had undergone evolution in the presence of decreased glucose often were involved in glycolysis, the tricarboxylic acid cycle, oxidative phosphorylation, and metabolite transport (Ferea, et. al., 1999). The lack of change in this gene suggests that it is likely not involved in the pathways of glucose metabolism. The genes that showed similar expression to this gene are not terribly significant because many included multiple gray spots, indicating that data was not available for these genes under certain conditions.
"Guilt by Association": Expression changes similar to groups of other genes
If the expression of YHR003C is closely related to the expression patterns of other genes whose functions are known, it may be hypothesized that the unknown gene functions in a similar pathway.
The expression of YHR003C in response to varying levels of zinc follows that of many different yeast genes (Lyons, et. al., 2000).
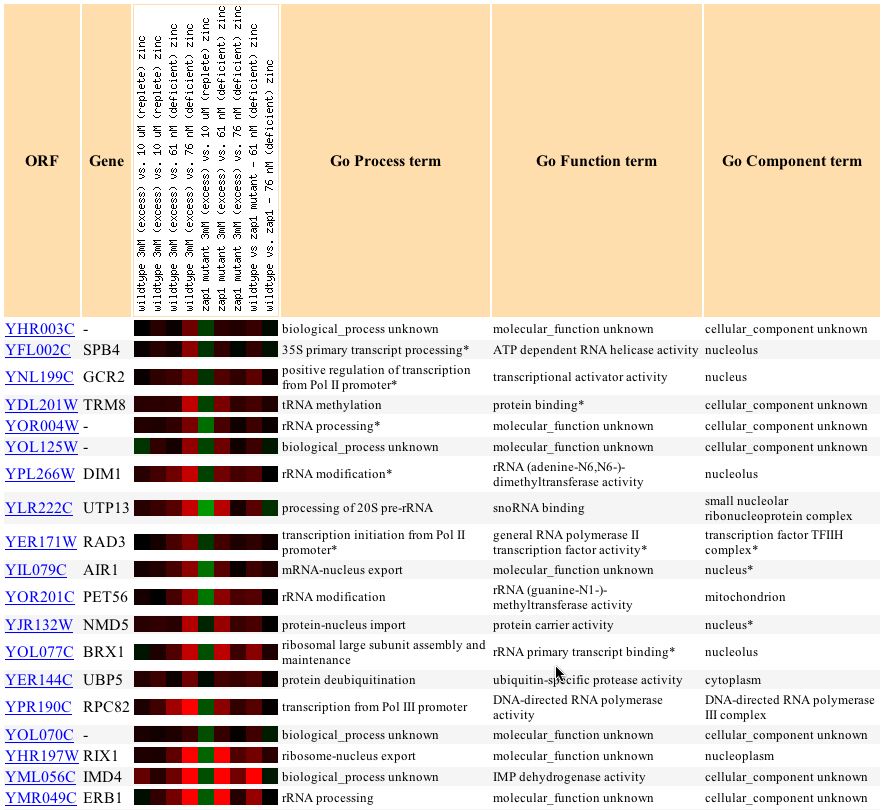
Gene Ontology analysis, as was used to show that GPA1 clustered significantly with nucleotide metabolizing proteins, shows that YHR003C clusters with a high level of significance to several biological process categories of genes in this experiment.
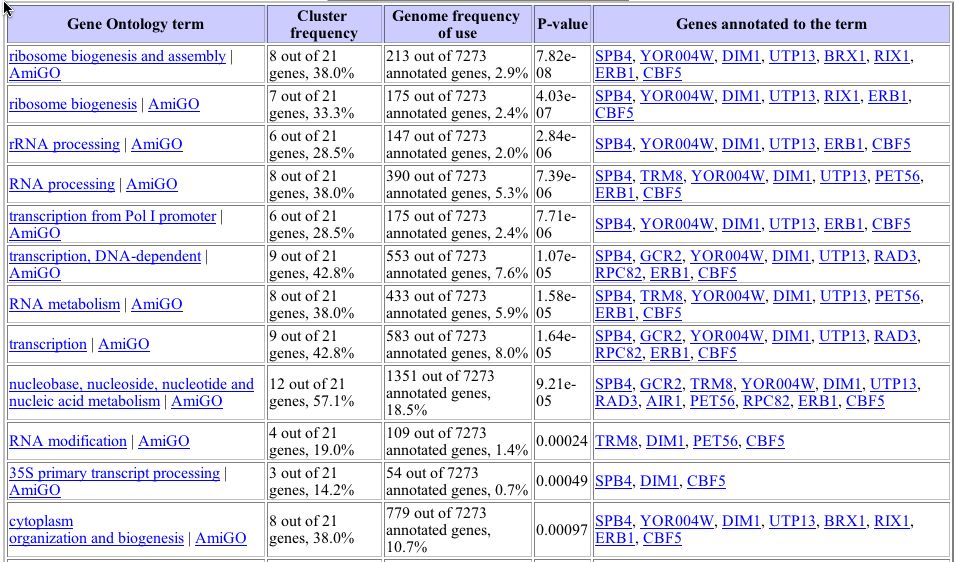
Image from: http://db.yeastgenome.org/cgi-bin/SGD/GO/goTermFinder
This table shows that many genes clustered with YHR003C are involved in ribosome biogenesis, metabolism, and RNA processing. This is consistent with the information gleaned in the previous webpage analyzing this gene, which showed that YHR003C was similar to genes involved in molybdopterin and thiamine biosynthesis and binding to nucleotides.
During exposure to varying phosphate levels, YHR003C is seen to be slightly repressed, as seen in the figure below (Ogawa, et.al., 2000).
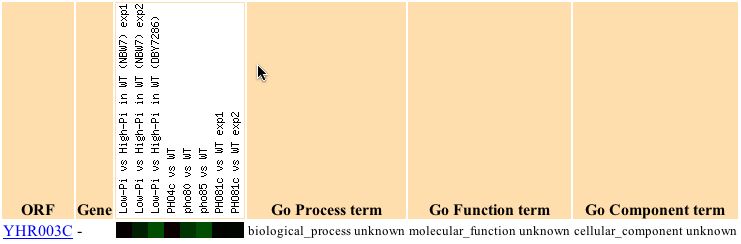
When genes whose expression patterns are clustered with that of YHR003C are analyzed, some significant categories are found as seen in the table below:
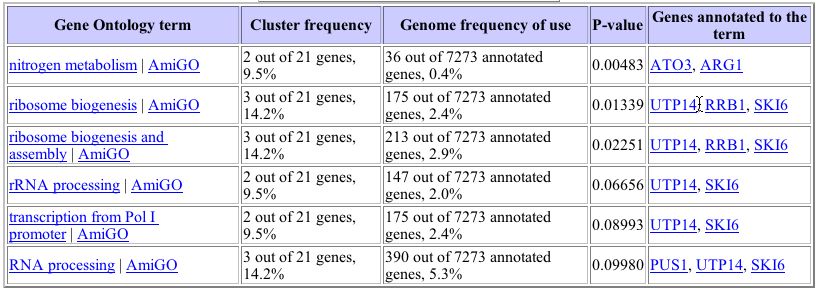
Image from: http://db.yeastgenome.org/cgi-bin/SGD/GO/goTermFinder
A significant number of these genes are involved in ribosome biogenesis, metabolism, and RNA processing as were those related to the expression of YHR003C in the zinc experiments.
As shown in the graph below, YHR003C is repressed and then induced during sporulation
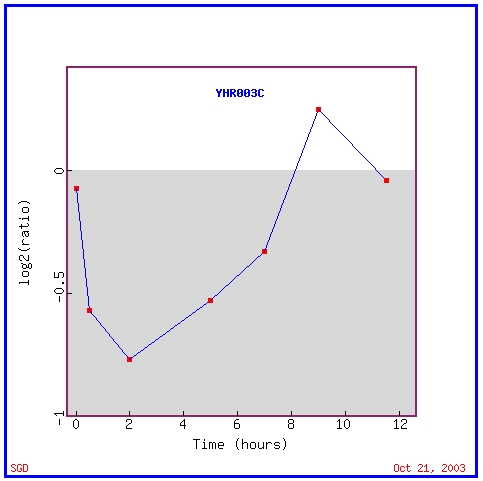
As shown in the graph above, YHR003C is repressed and then induced during sporulation, the process through which diploid yeast produce haploid offspring (Chu, et.al., 1998). This pattern of expression is similar to many other genes in the yeast genome:
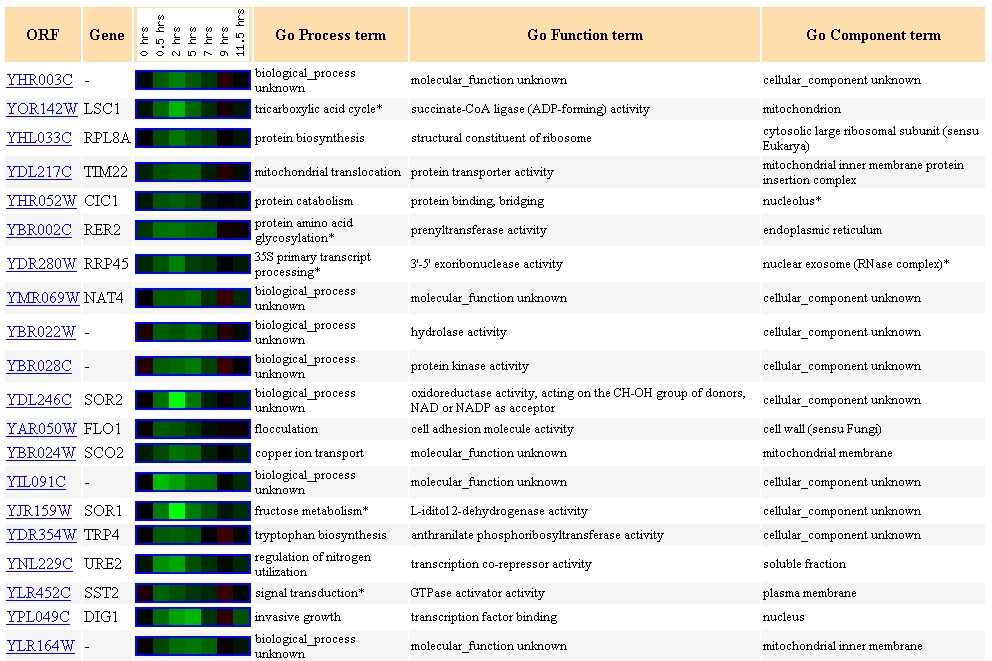
One common theme seen among these genes with a similar expression pattern is that several (YLR164W, SCO2, TIM22, and LSC1) are associated with the mitochondrion. Several other genes (such as RPL8A, TRP4) are involved in biosynthesis.
Experiments showing large changes in expression
A third category of significant experimental data, experiments in which a gene shows large changes in expression, may also give information about gene function. The most drastic change recorded in the Expression Connection experiments was seen during the progression into stationary phase. During this progression into stationary phase, YHR003C is repressed as much as 2.8 fold:
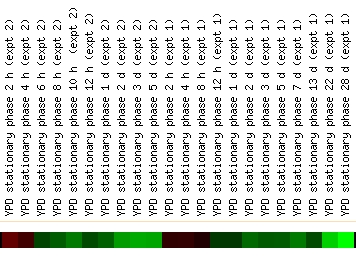
Both experiments shown in this figure indicate that YHR003C is slightly induced and then greatly repressed (Gasch, et. al., 2000). Stationary phase is defined as the phase of yeast growth at which there is no net increase in cell number. Thus, processes of rapid cell growth do not occur nearly as much during stationary phase (Braun, et. al., 1996). The gene expression pattern of YHR003C is thus consistent with a protein that is involved in biogenesis- it is active before the yeast is fully in stationary phase but then is greatly repressed as the cell proliferation slows to a minimum.
The other environmental stress conditions included in this dataset do not show a consistent response. YHR003C is sometimes slightly repressed, other times slightly induced, and under still other conditions, shows no change. This makes it difficult to place YHR003C into a category of ESR (Gasch, et. al, 2000).
Revised Prediction of YHR003C Function
The theme throughout this expression data that continues to surface is that YHR003C appears to cluster with genes involved in biosynthesis and metabolism. This data supports the prediction made on the previous webpage that YHR003C is an enzyme involved in biosynthesis and metabolism. The two different experiments which cluster YHR003C with ribosome biosynthesis genes would also lead to the more specific prediction that this non-annotated gene is involved in ribosome biogenesis.
References
Braun E.L. et. al. (1996). A stationary-phase gene in Saccharomyces cerevisiae is a member of a novel, highly conserved gene family. J Bacteriol. 178: 6865-72.
Campbell, et. al. (2003). Discovering Genomics, Proteomics, and Bioinformatics. Benjamin Cummings, pp. 107-117.
Chu S. et. al. (1998). The transcriptional program of sporulation in budding yeast. Science 282: 699-705.
DeRisi J.L. et. al. (1997). Exploring the metabolic and genetic control of gene expression on a genomic scale. Science 278: 680-6.
Dolinski, K. et. al. (2003). Saccharomyces Genome Database. <http://www.yeastgenome.org/> Accessed 2003 4 Oct.
Ferea T.L. et. al. (1999). Systematic changes in gene expression patterns following adaptive evolution in yeast. Proc Natl Acad Sci U S A 96: 9721- 6 <http://www.pnas.org/cgi/reprint/96/17/9721.pdf> Accessed 2003 21 Oct.
Gasch A.P. et al. (2000) Genomic expression programs in the response of yeast cells to environmental changes. Mol Biol Cell 11: 4241-57.
Gene Ontology Software Group. 2003. Gene Ontology Database.<http://www.godatabase.org/dev/database/> Accessed 2003 5 Oct.
Lyons T.J. et. al. (2000) Genome-wide characterization of the Zap1p zinc-responsive regulon in yeast. Proc Natl Acad Sci U S A 97: 7957-62.
Ogawa N. et al. (2000) New components of a system for phosphate accumulation and polyphosphate metabolism in Saccharomyces cerevisiae revealed by genomic expression analysis. Mol Biol Cell 11:4309-21.
Roberts C.J. (2000) Signaling and circuitry of multiple MAPK pathways revealed by a matrix of global gene expression profiles. Science 287: 873-80.
Wyrick J.J. (1999) Chromosomal landscape of nucleosome-dependent
gene expression and silencing in yeast. Nature 402: 418-21.
Questions or Comments? Please e-mail Rachel Patton McCord
Rachel Patton McCord's Genomics Homepage