This web page was produced as an assignment for an undergraduate course at Davidson College.
My Favorite Yeast Expressions
Using online databases that provide access to the results of various microarray experiments, anyone can research the expression of annotated and non-annotated yeast genes. This web page is another step in the direction to understanding the function of the annotated yeast gene GDA1 and the non-annotated yeast gene YEL043W.
Microarray experiments allow scientists to compare the change in expression level of particular genes under various environmental conditions and within different biological processes. Using this technique, the expression of one gene can be compared to the expression of other genes under the same conditions. If one gene behaves similarly to other genes under identical experimental conditions, the genes can often be linked together as having a similar function. This process of identifying one gene with a group of genes of similar expression is called "guilt by association." For further explanation of the methodology and principle behind microarrays, click here.
GDA1
The following images document some conditions under which GDA1 expression changes in concert with other yeast genes. These analyses will hopefully provide more insight into the function of GDA1. Figure 1 defines the color scale used in the following microarray experiments.

Figure 1. The color gradient used in microarray experiments. Green indicates the gene is being repressed, black indicates no change in gene expression, and red signifies induction, or an increase in gene expression. Image provided by http://db.yeastgenome.org/cgi-bin/expression/expressionConnection.pl. Permission pending.
Sporulation
Sporulation is the process of diploid yeast cells producing haploid cells. Both meiosis and spore morphogenesis allow for this duplication of chromosomes within the cell (Chu et al., 1998). Chu and colleagues used DNA microarrays to observe yeast gene expression during sporulation. Below is a list of genes, both annotated and non-annotated, and their documented functions and expression level during sporulation (Figure 2). Genes within this list have a Pearson correlation coefficient greater than 0.8 with GDA1.

Figure 2. Genes observed having similar expression patterns during yeast sporulation. To the right of the expression patterns are the biological processes in which the genes are involved and their function within the processes. Image provided by http://db.yeastgenome.org/cgi-bin/expression/expressionConnection. Permission pending.
As the sporulation process progresses, GDA1 becomes more induced, or expressed. This expression pattern fits with the functional role of GDA1 of protein modification within the Golgi. During sporulation, chromosomes within the diploid cells are duplicating to haploid cells. This process of DNA replication and cell division requires the aid of many proteins, which would result in increased expression of GDA1.
Below is a graphical representation of GDA1 expression during sporulation Again, one can see the general trend of increased expression during sporulation.

Figure 3. A graph of GDA1 expression during sporulation over a time period of 12 hours. A slight repression occurs between hour 2 and 5, but throughout most of the experiment, GDA1 is induced. Image provided by http://db.yeastgenome.org/cgi-bin/expression/expressionConnection. Permission pending.
Diauxic Shift
DeRisi and colleagues (1997) created a DNA microarray to observe the majority of Saccharomyces cerevisiae genes during a metabolic shift from anaerobic fermentation of glucose to aerobic respiration of ethanol (diauxic shift).
During this metabolic shift, GDA1 expression is repressed (Figure 4). The graph below indicates dramatic repression of GDA! expression occurs nearly 12 hours into the shift from fermentation to respiration (Figure 5). This suggests that GDA1 is slightly expressed during the preferred metabolic process of fermentation, but is shut off after the glucose supply is exhausted.
 Figure 4. Genes that share similar expression patterns with GDA1 during a diauxic shift. Image provided by http://db.yeastgenome.org/cgi-bin/expression/expressionConnection. Permission pending.

Figure 5. A graphical display of GDA1 repression during a diauxic shift. GDA1 is not highly induced during fermentation, but becomes greatly repressed once respiration begins. Image provided by http://db.yeastgenome.org/cgi-bin/expression/expressionConnection. Permission pending.
DNA Damaging Agents
Gasch and colleagues (2001) were interested in the genomic response of S. cerevisiae when treated with two different DNA damaging agents, methylating-agent methylmethane sulfonate (MMS) and ionizing radiation. In their experiment, Gasch and colleagues treated both wildtype cells and cells whose DNA damage notification and modulation pathways were disrupted with MMS and ionizing radiation. Below are three other annotated genes that have a similar response to GDA1 (Figure 6). KAP123 imports proteins into the nucleus, while YEF3 is involved is a translation elongation factor, and GUA1 acts as a GMP synthase (SGD, 2005; http://db.yeastgenome.org/cgi-bin/expression/expressionConnection.pl). These four genes are all involved in protein production and transport, a great example of the "guilt by association" principle.

Figure 6. Image of three genes with expression similar to GDA1 after DNA damage occurs within S. cerevisiae cells. GDA1 seems to be slightly induced throughout the experiment. This image demonstrates the "guilt by association" principle. Image provided by http://db.yeastgenome.org/cgi-bin/expression/expressionConnection. Permission pending.
Alpha Factor Exposure
Roberts and colleagues (2000) observed the genomic response of S. cerevisiae when exposed to the mating pheromone alpha factor over a designated length of time. They analyzed pheromone signaling, cell cycle control, and polarized morphogenesis during the genome's exposure to alpha factor. Figure 7 shows initial repression of GDA1, followed by a near return to initial expression level before the alpha factor treatment.

Figure 7. Graphical display of GDA1 expression after exposure to alpha factor. Repression occurs an hour into the experiment. Image provided by http://db.yeastgenome.org/cgi-bin/expression/expressionConnection. Permission pending.

Figure 8. Genes, both annotated and non-annotated, with expression similar to GDA1 after exposure to alpha factor. Note how some of the genes have functions related to GDA1 (eg, ALG3) while some gene functions are unknown. It is therefore possible that the non-annotated genes with expression similar to GDA1 serve some sort of protein synthesis function. Image courtesy of http://db.yeastgenome.org/cgi-bin/expression/expressionConnection. Permission pending.
Above, Figure 8 shows both annotated and non-annotated genes sharing similar expression patterns after being exposed to alpha factor over the course of two hours. The annotated gene ALG3 is involved in mannosylation, a process in which GDA1 is also involved. Using the "guilt by association" principle, it is therefore reasonable to hypothesize that a non-annotated gene with an expression pattern similar to these two genes, such YOR084W, is involved in protein production like ALG3 and GDA1.
Varying Zinc Levels
Using Zap1p, a transcription factor able to detect cellular levels of zinc, Lyons and colleagues (2000) used DNA microarrays and conditions of varying zinc levels to identify Zap1p-targeted genes. GDA1's expression throughout this experiment is very similar to many other annotated genes that are involved in transcription, translation, and protein synthesis (Figure 9). This is another good example of "guilt by association."

Figure 9. A list of genes with expression similar to GDA1 when exposed to various levels of zinc. Again, this is an excellent example of "guilt by association." Image provided by http://db.yeastgenome.org/cgi-bin/expression/expressionConnection. Permission pending.
Calcineurin/Crz1 Pathway
Calcineurin is a calcium-dependent protein that is activated by particular environments, such as changing levels of calcium or sodium within the cell. Using DNA microarrays, Yoshimoto and colleagues (2002) identified calcineurin-dependent genes by exposing genes to various levels of calcium and sodium. It seems as though little is known about the genes that share similar expression patterns with GDA1 under these experimental conditions (Figure 10). In this case, less information can be gathered about both the role of the annotated and non-annotated genes in the calcineurin/Crz1 pathway.

Figure 10. A list of genes, many non-annotated, with expression patterns similar to GDA1. Image provided by http://db.yeastgenome.org/cgi-bin/expression/expressionConnection. Permission pending.
Non-annotated gene: YEL043W
Because YEL043W is a non-annotated gene, we rely heavily on microarray experiments to gain insight into the possible role of the gene by comparing the expression of the gene under particular experimental conditions to other genes within the array. If YEL043W has a similar expression pattern as certain known genes, we can hypothesize that the two genes play similar roles under that particular condition. More specific experiments can then be designed and run to gather more information about the gene's function. Keep in mind throughout this analysis the proximate location of GDA1 and YEL043W (Figure 11). Although these two genes lie next to each other on chromosome 5, they do not necessarily serve similar functions.
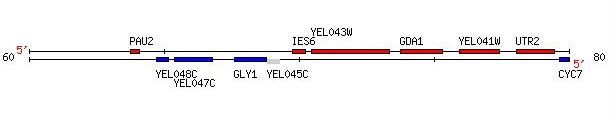
Figure 11. This figure shows the relative location of YEL043W to GDA1. Both genes lie on the Watson strand of chromosome 5 of S. cerevisiae. Image provided by http://db.yeastgenome.org. Permission pending.
In general, YEL043W undergoes relatively changes in gene expression (Figure 12). Most changes are less than two-fold. This fact probably contributes to the reason YEL043W remains a non-annotated gene; its change in transcription in experiments conducted thus far is fairly small.

Figure 12. A display of the fold change of the non-annotated gene YEL043W within many experiments. The fold change of this non-annotated gene is rarely greater than two. Image provided by http://db.yeastgenome.org/cgi-bin/expression/expressionConnection.pl. Permission pending.
Sporulation
YEL043W is repressed during Chu and colleagues' (1998) sporulation experiment (Figure 13). Under the same experimental conditions, GDA1 was induced. This observation reinforces the idea that physical proximity does not necessarily result in similar gene expression or function. Because the genes with expressions most similar to YEL043W are non-annotated as well, it is difficult to use the "guilt by association" principle to infer about the function of YEL043W. More information needs to be gathered before making a reasonable hypothesis about the function of YEL043W. Note, however, that PFY1 responds to osmotic stress and participates in actin monomer binding.

Figure 13. A list of genes with similar expression to YEL043W during sporulation. Image courtesy of http://db.yeastgenome.org/cgi-bin/expression/expressionConnection. Permission pending.
Environmental Changes
Gasch and colleagues (2000) exposed the S. cerevisiae genome to ten different environmental conditions, including hydrogen peroxide and hyper- and hypo-osmotic shock, and observed changes in genomic expression patterns using DNA microarrays. The fold change of YEL043W during this experiment was relatively large (-3.5), but the SGD database did not return any genes with similar expression patterns, making it difficult to hypothesize the function of YEL043W within all of these environmental changes (Figure 14). Notice YEL043W slight very induction during hypo-osmotic shock.

Figure 14. A portion of the expression of YEL043W under various environmental conditions. Unfortunately, the SGD database does not return any other genes with similar expressions, making it impossible to use the "guilt by association" principle. Image courtesy of http://db.yeastgenome.org/cgi-bin/expression/expressionConnection. Permission pending.
Varying Zinc Levels
Similar to GDA1, YEL043W shares fairly similar expression patterns with many annotated genes under Lyons and colleagues (2000) experimental conditions of varying zinc levels (Figure 15). Again we see YEL043W somewhat related to a gene involved in osmosensor activity, MSB2.

Figure 15. Genes with expression levels similar to YEL043W when responding to environments with varying levels of zinc. Image provided by http://db.yeastgenome.org/cgi-bin/expression/expressionConnection. Permission pending.
Predictions
It is quite apparent that much less data is available for the non-annotated gene YEL043W compared to the annotated GDA1. Also, YEL043W's expression levels are fairly mild, making it difficult to provide any predictions regarding its function. Although I am not very clear on YEL043W's function, employing the "guilt by association" principle where I can, I predict that YEL043W is not involved in cellular reproduction due to its repression during sporulation, but rather plays a regulatory role within the cell. YEL043W is slightly induced under varying levels of zinc concentration, along with an osmosensor gene, and also exhibits slight induction under changes in osmotic conditions. I therefore predict that YEL043W serves as a environmental regulation gene, possibly aiding in protein production during a change in osmotic pressure. Due to its relatively weak induction and repression expression, however, I do not believe YEL043W acts as a first responder gene.
References
Chu S, DeRisi J, Eisen M, Mulholland J, Botstein D, Brown PO, Herskowitz I. 1998. The transcriptional program of sporulation in budding yeast. <http://db.yeastgenome.org/cgi-bin/reference/reference.pl?dbid=S000055354>. Accessed 2005 Oct 19.
DeRisi JL, Iyer VR, Brown PO. 1997. Exploring the metabolic and genetic control of gene expression on a genomic scale. <http://db.yeastgenome.org/cgi-bin/reference/reference.pl?dbid=S000045635>. Accessed 2005 Oct 19.
Gasch AP, Huang M, Metzner S, Botstein D, Elledge SJ, Brown PO. 2001 Genomic expression responses to DNA-damaging agents and the regulatory role of the yeast ATR homolog Mec1p. <http://db.yeastgenome.org/cgi-bin/reference/reference.pl?dbid=S000066021>. Accessed 2005 Oct 19.
Gasch AP, Spellman PT, Kao CM, Carmel-Harel O, Eisen MB, Storz G, Botstein D, Brown PO (2000) Genomic expression programs in the response of yeast cells to environmental changes. <http://db.yeastgenome.org/cgi-bin/reference/reference.pl?dbid=S000059106>. Accessed 2005 Oct 19.
Lyons TJ, Gasch AP, Gaither LA, Botstein D, Brown PO, Eide DJ. 2000. Genome-wide characterization of the Zap1p zinc-responsive regulation in yeast. <http://db.yeastgenome.org/cgi-bin/reference/reference.pl?dbid=S000049083>. Accessed 2005 Oct 19.
Roberts CJ, Nelson B, Marton MJ, Stoughton R, Meyer MR, Bennett HA, He YD et al. 2000. Signaling and circuitry of multiple MAPK pathways revealed by a matrix of global gene expression profiles. <http://db.yeastgenome.org/cgi-bin/reference/reference.pl?dbid=S000049908>. Accessed 2005 Oct 19.
Yoshimoto H, Saltsman K, Gasch AP, Li HX, Ogawa N, Botstein D, Brown PO, et al. 2002. Genome-wide analysis of gene expression regulated by the calcineurin/Crz1p signaling pathway in Saccharomyces cerevisiae. <http://db.yeastgenome.org/cgi-bin/reference/reference.pl?dbid=S000070310>. Accessed 2005 Oct 19.
Questions or comments? E-mail Caitlin Kiley at cakiley@davidson.edu
Return to Davidson College Biology Home Page
Return to Genomics Home Page
Return to Caitlin Kiley's Home Page
Return to Davidson College Home Page