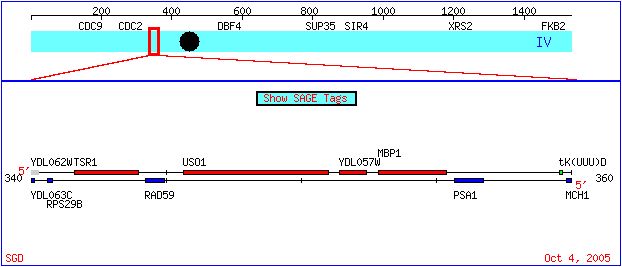
This webpage examines the expression of two genes from the genome of bakers' yeast, or S. cerevisiae. The two genes of focus are MBP1, which has been annotated and has an experimentally determined role in the cell cycle, and YDL057W, a non-annotated gene. The position of these genes on the yeast chromosome IV can be seen below (Figure 1).More about these genes can be found here. This webpage uses data from DNA microarray experiments to illustrate the expression patterns of these two genes under various conditions. If you are not familiar with DNA microarrays and how they can be used to visualize trends in expression, please visit this site. The scale by which we will judge induction or repression of gene expression is presented below (Figure 2).
Figure 1. The location of YDL057W and MBP1 on the S. cerevisiae chromosome IV. Diagram taken from the Saccharomyces cerevisiae Genome Database .
Figure 2. Scale by which induction or repression will be judged. Ratios are expressed as red/green, and if the ratio is greater than one, the gene is induced. If it is less than one, the gene is repressed. From Expression Connection.
MBP1 is short for MluI-box Binding Protein, and it codes for a transcription factor involved in regulating the cell cycle (Lane et al. 2000; Cheng et al. 1997). According to Cheng et al. (1997), "cells progress through four distinct phases, G1, S, G2 and M [during the cell cycle, and] transcriptional controls play an important role at the transition between these phases." MBP1 and another gene, Swi6, code for the proteins that make up what is called the "MCB-binding factor (MBF)," which "binds to [...] so-called MCB (MluI cell-cycle box) [...] and activates the transcription of [genes] at the G1-->S phase transition" (Cheng et al. 1997). To learn more about the MBP1 gene, visit a previous assignment. In the present assignment, I will show expression patterns of MBP1 under different conditions. The expression patterns are experimentally determined using DNA microarrays.
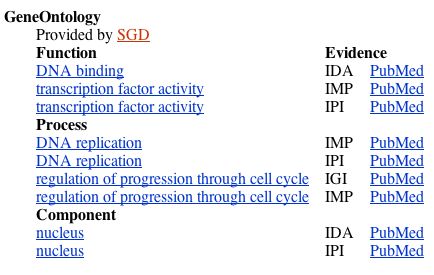
Figure 3. The molecular function, biological process, and cellular component of the MBP1 transcription factor, from NCBI Gene .
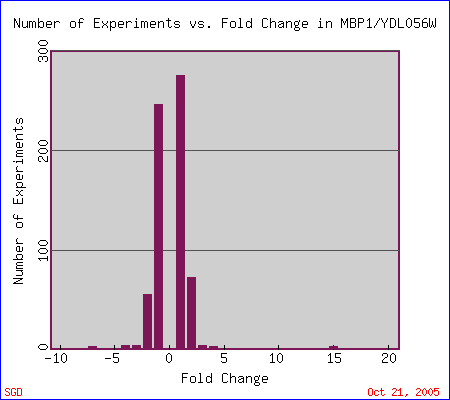
The following is a graph showing the number of experiments that have been conducted in which MBP1 expression has been induced (above 0 on the x-axis) or repressed (below 0 on the x-axis).
Figure 4. Graph showing fold change in the expression of MBP1 and the number of experiments that indicate each change. From Expression Connection.
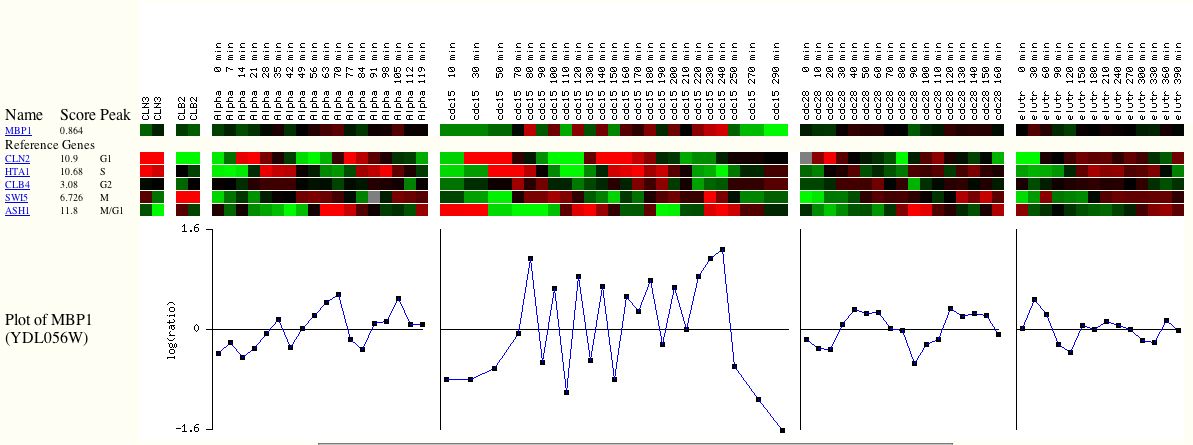
a. Expression of MBP1 during the cell cycle. Most experiments where MBP1 demonstrates a change in expression have been performed on its expression during cell cycle. As you can see from the MBP1 bar below (Figure 5), the gene is both highly induced and highly repressed at various points during the cycle.
Figure 5. Expression of MBP1 during cell cycle. Below MBP1 are reference genes that are known to be involved in the cell cycle, for comparison. The plot of MBP1 indicates its expression over time. When the data points fall above one, it indicates that the gene is induced. When they fall below one, it indicates that the gene is repressed. From Expression Connection.
Figure 6. This figure is a valuable find; regulatory flow charts are not available for every annotated gene. The flow chart indicates the proposed interaction of MBP1 with other genes during the cell cycle. Repression or induction of a gene by another is indicated by the small green (repression) or red (induction) arrows in the oval of each regulatory molecule. From Expression Connection.
b. Expression of MBP1 during environmental changes The maximum induction of MBP1 was ~15-fold, due to environmental changes. In particular, Gausch et al. (2001) exposed the yeast to a temperature of 29-33 degrees Celsius for 30 minutes (Gausch et al. 2001). This induction can be seen as the bright red square below (Figure 7). In addition, MBP1 expression is repressed (~4-fold) due to other environmental changes. In this case, the yeast was exposed 2.5mM of the disulfide-reducing agent dithiothreitol (DTT) for 120 minutes (Gausch et al. 2001). This repression shows up as a bright green square below (Figure 7).
Figure 7. Expression of MBP1 during various environmental changes. Greatest induction can be seen when yeast is exposed to a temperature of 29-33 degrees Celsius for 30 minutes, while the greatest repression is when yeast is exposed to 2.5 mM of DTT for 120 minutes. From Expression Connection.
YDL057W is a non-annotated gene in the S. cerevisiae genome, meaning that as of yet it has no known function. In a previous webpage assignment I characterized the gene and made a prediction as to its function. You can view that assignment here. In the present assignment, I will show expression patterns of YDL057W determined with DNA microarray technology and re-evaluate my prediction.
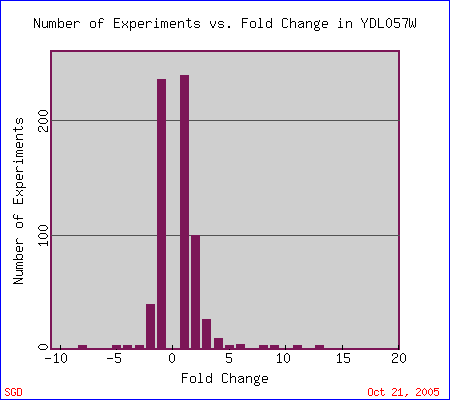
The following is a graph showing the number of experiments that have been conducted in which YDL057W expression has been induced (above 0 on the x-axis) or repressed (below 0 on the x-axis).
Figure 8. Graph showing fold change in the expression of YDL057W and the number of experiments that indicate each change. From Expression Connection.
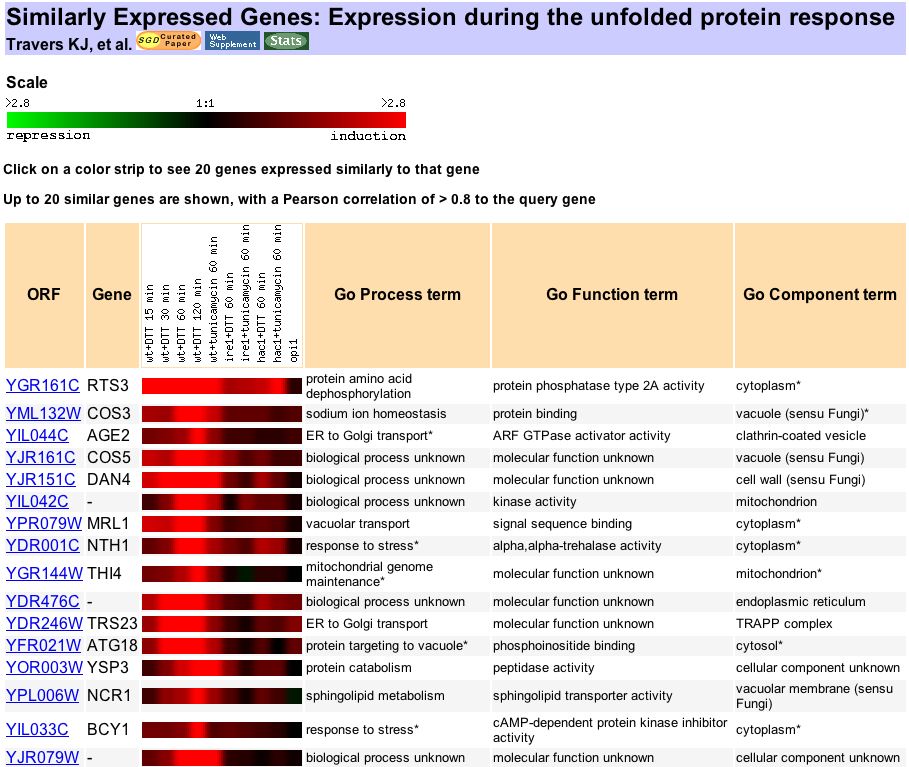
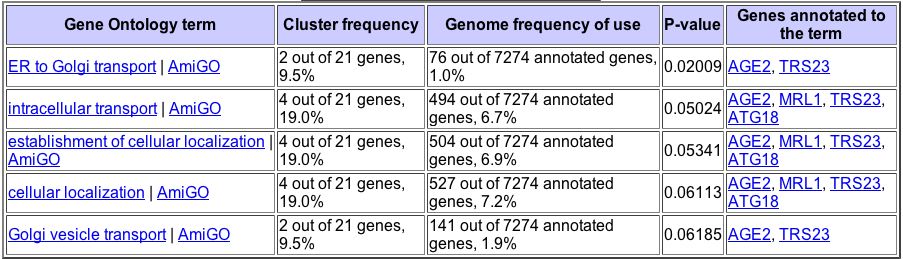
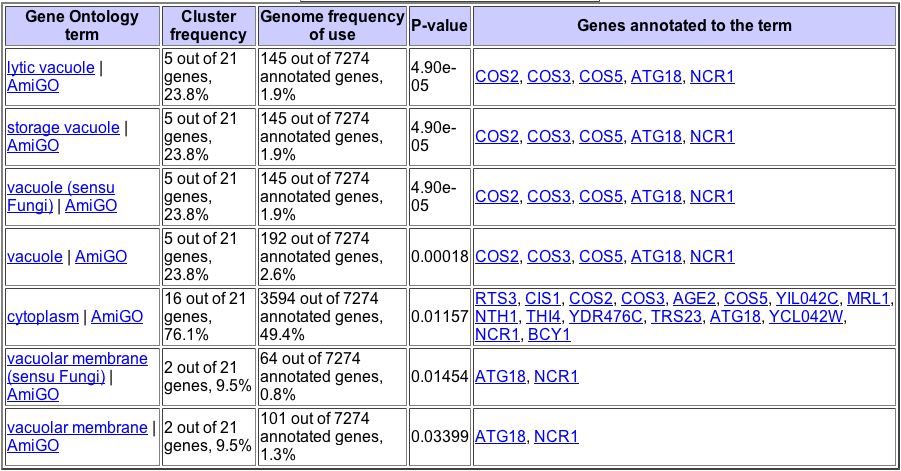
The maximum induction of YDL057W was ~13-fold, during the unfolded protein response. According to Travers et al. (2000), " unfolded protein response (UPR) regulates gene expression in response to stress in the endoplasmic reticulum (ER)." YDL057W clusters with other genes that had similar responses to UPR (Figure 9). GeneOntology shows that YDL057W significantly clusters with these similarly expressed genes based on common biological processes and cellular components (Figures 10 and 11).
Figure 9. Genes that show significant expression to YDL057W during UPR. From Expression Connection.
Figure 10. The Gene Ontology Term Finder allows users to find genes that significantly cluster with a gene of interest based on their biological processes, molecular functions, and cellular components. This figure shows genes that significantly cluster with YDL057W based on their biological processes.
Figure 11. This figure shows genes that significantly cluster with YDL057W based on their cellular components. From the Gene Ontology Term Finder.
According to the Guilt By Association theory (Campbell et al. 2002), we may be able to predict a function for YDL057W based on the function of these genes with similar expressions under various conditions.
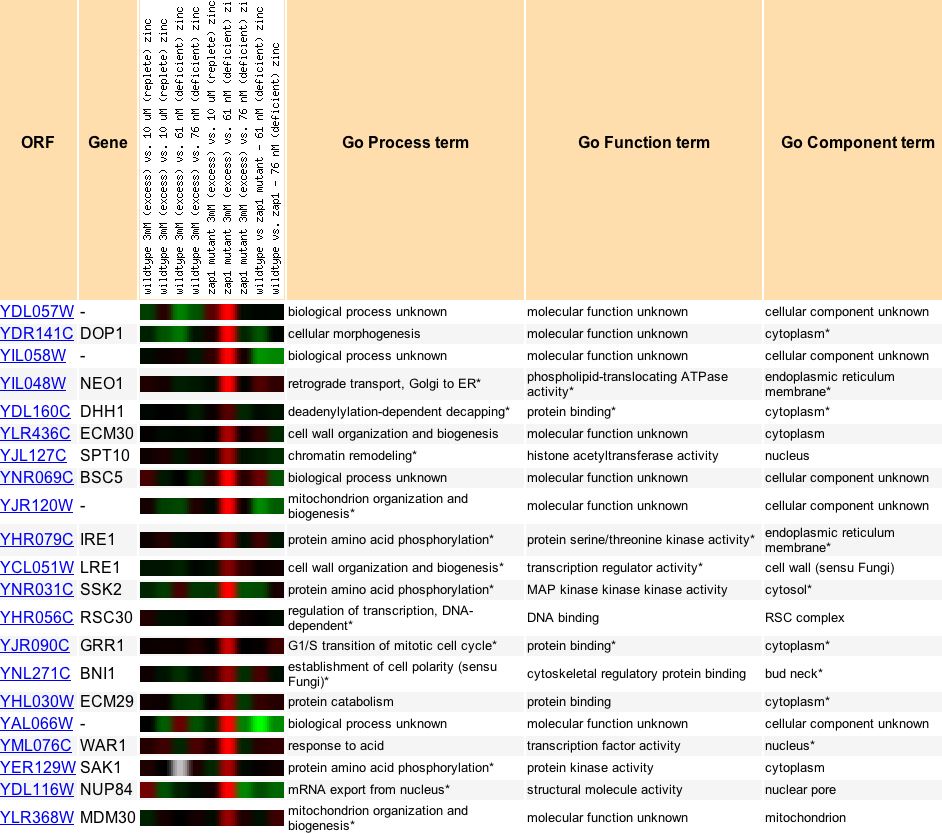
b. Expression differs based on levels of zinc in a zap1p mutant YDL057W is also greatly induced (~9-fold) in response to varying zinc levels in Zap1p mutants (Figure 12). The zap1p "transcription factor senses cellular zinc status and increases expression of its target genes in response to zinc deficiency" (Eide DJ et al. 2000). The induction of YDL057W peaks when a mutant with excess zinc is compared to a mutant with zinc deficiency (only 61 nM).
Figure 12. YDL057W is induced in excess-zinc zap1p mutants compared to zinc-deficient zap1p mutants. It is shown with other genes that showed similar expression patterns. From Expression Connection.
c. Prediction of YDL057W's function It has been experimentally determined that the disruption of YDL057W has a null effect on the survival of the yeast, so clearly it is not an essential gene (Nicolas et al. 1999). YDL057W is highly induced during the UPR and clusters (based on both cellular component and biological process) with other genes that are involved in transport from the ER. Indeed, some of the genes induced in the zinc experiments (Figure 12) were also involved in transport or located on the ER membrane. Thus, from the data shown, using the Guilt By Association theory, I would hypothesize that YDL057W is involved in transport from the ER.
DNA microarrays open the door for literally millions of experiments to be performed. Each experiment will increase our understanding of genomes to give us a better view of the "overall" organism. In this assignment, I have garnered some impressive DNA microarray data for two genes, MBP1 and the non-annotated YDL057W. As shown by my revised prediction, expression data from microarrays can help us tentatively annotate some genes with unknown function by viewing what annotated genes have similar expression. This method is called "guilt by association," and is not sufficient by itself, but must be followed by experiments to confirm the annotation (Campbell et al. 2002).
Campbell, et. al. (2002). Discovering Genomics, Proteomics, and Bioinformatics. Benjamin Cummings, pp. 107-136.
Gasch AP, Spellman PT, Kao CM, Carmel-Harel O, Eisen MB, Storz G, Botstein D, Brown PO (2000) Genomic expression programs in the response of yeast cells to environmental changes. Mol Biol Cell 11(12): 4241-57.
Lyons TJ, Gasch AP, Gaither LA, Botstein D, Brown PO, Eide DJ (2000) Genome-wide characterization of the Zap1p zinc-responsive regulon in yeast. Proc Natl Acad Sci U S A 97(14): 7957-62.
McIntosh, PB, Taylor IA, Frenkiel TA, Smerdon SJ, Lane AN (2000) The influence of DNA binding on the backbone dynamics of the yeast cell-cycle protein Mbp1. J of Biomol NMR 16(3): 183-196.
Smith, KN, Iwaneiko L, Loeillet S, Fabre F, Nicolas A (1999) Disruption and functional analysis of seven ORFs on chromosome IV: YDL057w, YDL012c, YDL010w, YDL009c, YDL008w ( APC11), YDL005c ( MED2) and YDL003w ( MCD1). Yeast Functional Analysis Report 15(12): 1255-1267.
Travers KJ, Patil CK, Wodicka L, Lockhart DJ, Weissman JS, Walter P (2000) Functional and genomic analyses reveal an essential coordination between the unfolded protein response and ER-associated degradation. Cell 101(3): 249-58.
Xu RM, Koch C, Liu Y, Horton JR, Knapp D, Nasmyth K, Cheng X (1997) Crystal structure of the DNA-binding domain of Mbp1, a transcription factor important in cell-cycle control of DNA synthesis. Structure 5(3): 349-58.
|