In a previous assignment, I investigated the function of the two yeast genes Ric1 and YLR036C. Here, I continue my investigation of Ric1 and YLR036C by analyzing their expression patterns under a variety of environmental conditions. Data was obtained with the expression connection database found at the Saccharomyces Genome Database.
Expression Overview
A standard red/green scale was used to describe the level of induction and repression under specific experimental conditions (Figure 1).

Figure 1: Repression/induction scale of gene expression. For any gene, induction and repression are measured by dividing the level of expression of the gene under experimental conditions by the gene's expression under control conditions. Numerical values represent the fold of repression or induction.
Annotated Yeast Gene: Ric1
Gene Ontology Summary
As discussed in a companion web site, the Ric1 gene encodes a periphreal membrane protein specific to the nucleus and the golgi apparatus. The Ric1 protein functions in intracellular membrane transport. Specifically, performs a guanyl-nucleotide exchange that is essential to SNARE-mediated membrane fusion.
Expression across the cell cycle
As a starting point, expression levels across the cell-cycle were investigated. The expression patterns appeared to be specific to individual strains. For example, Ric1 was strongly induced (10.9 fold) at a single time point in the temperature sensitive mutant (Spellman PT et al., 1998). No similar pattern was seen in the alpha strain (Figure 2). The result of the Spellman et al. study are evidence that variability in Ric1 expression might vary between cell lines. No other gene expressions were correlated to Ric1 in the Spellman et al. study.

Figure 2: Expression of Ric1 during the cell cycle. The strongest induction is observed in the cdc15 temperature-sensitive mutant at 12C minutes. The strongest reduction is observed in the same mutant strain (cdc15) at 21C minutes. The Ric1 is upregulated (log2ratio = 10.3) at a specific time point. Data retrieved with expression connection.
Sporulation
The expression of Ric1 during sporulation was investigated by Chu et al (1998). As seen in Figure 3, Ric1 was heavily reduced at all stages of sporulation. . Multiple other genes were found to have similar expression patterns during sporulation. However, the genes had diverse all stages of sporulation but had diverse functions and no single

Figure 3: Ric1 is downregulared during sporulation. Maximum repression occurred at 9 minutes (log2 ratio = -3.1). Study conducted by Chu et al. (1998). Data retrieved using expression connection.
Environmental stress expressions: Ric1 finds a friend
After examining the expression of Ric1 across the cell cycle and sporulation, the effects of various environmental stresses on Ric1 were investigated. The genome wide expression patterns produced by environmental shocks such as nitrogen depletion, amino acid starvation, and osmotic shock were published by Gasch et al. (2000). From their data, Ric1 expression was found to correlate with Kap114 expression across the tested conditions (Pearson correlation > 0.8). The Kap114 protein is involved in protein carrier activity and specifically functions in protein transport into the nucleus. It localizes to both the nucleus and the cytoplasm. The strongest correlation between the Kap114 and the Ric1 expressions was observed in the stationary phase and is shown in Figure 4. Seeing how Ric1 and Kap114 both are involved in protein transport across membranes and both cells localize to the nuclear membrane, the strong correlation is not surprising. It is possible that both proteins might contribute to the same membrane transport mechanism.
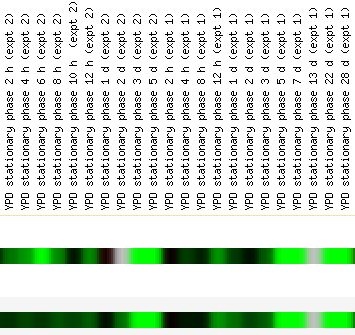
Figure 4: Expressions levels of Ric1 (top) and Kap114 (bottom) when exposed to stationary phase . Kap114 and Ric1 clustered across a range of environmental stress conditions. Data found at expression connection.
Glucose-Limited Medium
The relationship between Ric1 expression and glucose level was investigated with data found by Ferea et al. (1999). Three evolved strains were grown on glucose-limited medium for 250+ generations. There expression levels were then compared to the parental strain, which had been grown on a nutrient-rich medium. The expression of Ric1 was reduced in one of the three evolved strains (Figure 5). The reduced expression of Ric1 is likely evidence of an adaptation to the low-glucose environment. The benefit of reducing the expression of Ric1 is readily apparent. A yeast cell would want to minimize its energy expenditure in a low-glucose environment. Doing so means that fewer membrane fusion events will occur in a glucose-deprived yeast cell. Expressing Ric1 at normal levels will not benefit the cell but rather will be an unnecessary expenditure of energy. Therefore, the yeast cell that reduced its Ric1 expression at both the Golgi apparatus and the Nuclear membrane will have an adaptive advantage in the glucose deprived environment.
The study perforemed by Ferea et al. was only conducted to 250+ generations. Also, two of the evolved strains did not exhibit reduced expression of Ric1. More studies are necessary to validate the hypothesis that downregulation of Ric1 is advantageous in a low-glucose environment.

Figure 5: Evolution of Ric1 during glucose metabolism. Three yeast strains were cultured under identical glucose-limited conditions (0.08%). The three evolved strains were then compared with a parental strain that had been kept under normal conditions. Expression comparison shows a 1.2 fold repression of Ric1 expression in the second evolved strain.
Collectively, the data supports the accepted function of Ric1 as a transport protein. Its expression appears influenced by the cell's overall activity, which are largely determined by the energy it has available.
Non-Annotated Gene: YLR036C
In an earlier investigation of the YLR036C gene, I found evidence that it functions in sporulation. Here I use expression levels to to continue my study of the YLR036C gene.
Cell Cycle Expression Patterns
The expression of YLR036C during the cell cycle was measured in a genome wide study by Spellman et al. (1998). No other genes were found to have a statistically similar expression pattern to YLR036C.

Figure 6: YLR036C expression during the cell cycle (Spellman et al. 1998). Data collected through expression connection.
Sporulation Expression
The expression of YLR036c during yeast sporulation is shown with similar expressions patterns in Figure 6. YLR036c is heavily downregulated during sporulation. The ECM5 gene was found to have the strongest correlation with the YLR036c expression.
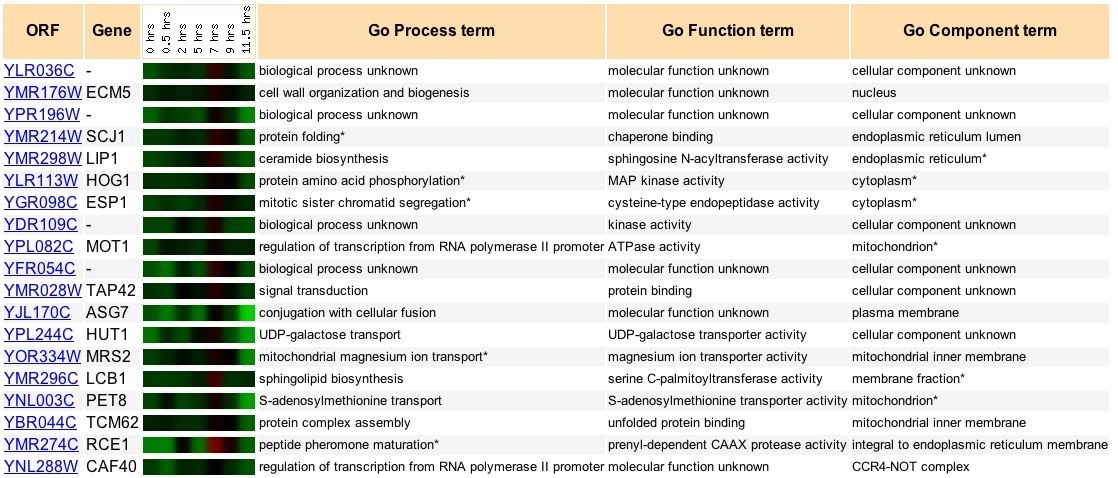
Figure 7: Comparison of YLR036C expression in sporulation with similar expressions. Expression patterns discoverd in genome wide-analysis of expression levels during yeast sporulation (Spellman et al., 1998). Data retrieved from expression connection.
Histone Depletion
Strong induction and repression were observed in YLR036c expression in the presence of histone depletion (Figure 6). Initially the expression of YLR036c rises sharply, but it is depressed accross the remaining hours. The expression appears to be consistent with a stress-response to histone depletion.
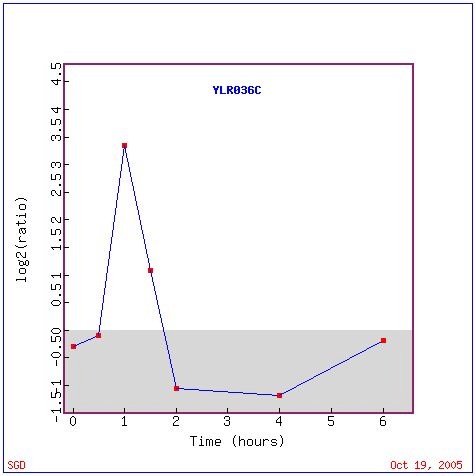
Figure 8: Expression of YLR036C expression in histone depletion (Wyrick et al. 1999).Graph retrieved using expression connection.
Several other genes were expressed similarly in the depletion of hishtone. The two gene expressions with the strongest correlations to YLR036c during histone depletion, Mdv1 and Yod1, both directly interact with DNA. The correlation observed between YLR036c and the other genes suggest that it might be involved in transcription or translation.
 Figure 9: YLR036c expression under histone-depletion (Wyrick et al. 1999). Data found at expression connection.
Environmental Stress Response
To expand from the histone-depletion study, the effects of various environmental responses on YLR036c expression were investigated. The strongest changes in expression were observed in nitrogen depletion the diauxic shift, and the stationary phase (Figure 10). Downregulation in the diauxic shift suggests that YLR036c is not involved in a stress response relating to nutrient depletion. Downregulation in the stationary phase is expected, as most gene expressions are repressed in the stationary phase. The response to nitrogen depletion, however, appears more promising. Immediately after the nitrogen depeletion, a slight induction of YLR036c is observed. This pattern is similar to the histone-depletion study. As in the histone-depletion study, YLR036c is repressed as the stress condition is continued. The downregulation in the abssence of nitrogen furthers the idea that YLR036c is involved in DNA synthesis, regulation or repair, as nitrogen is abundant in nucleic acids.
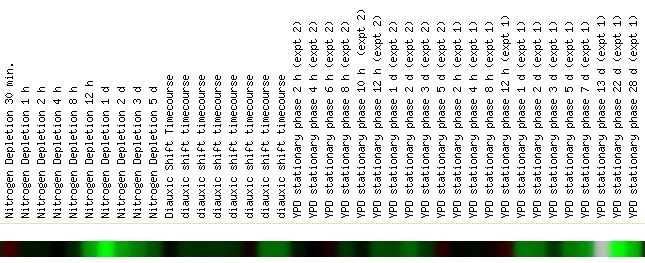
Figure 10: YLR036c expression is repressed in Nitrogen depletion and the stationary phase (Gasch et al., 2000). Data retrieved using expression connection.
Induction of YLR036c in mutant study
A study performed by Sudarsanam et al. suggests that the YLR036c gene might have a function in transcription (2000). When two transcription factors, snf2 and swi1, were deleted, the expression of several transcriptor regulators such as significantly Mcm1 and MATalpha were altered. The expression of YLR036c was consistently induced in the two mutants, showing that it was also affected by the loss of snf2 and swi1 (Figure 11). The connection was promising, as earlier observations suggested that YLR036c might function in a transcription-related process. However, YLR036c does not correlate with a transcription factor in the study. Instead, it correlates with a variety of genes. The strongest correlation was observed between YLR036c and Trs23, which encodes a golgi transport protein. The main significance of the results is that YLR036c expression is strongly effected by the deletion of snf2 and swil. Whether this is a direct regulation or requires a more complex mechanism can only be determined with more research.
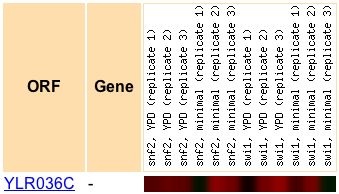
Figure 11: YLR036c is consistently induced in snf2 and swi1 mutants (Sudarsanam et al., 2000). The snf2 and swil have been characterized as controlling other transcriptor regulators. Comparison to related expressions available at expression connection.
The Search Continues
The expression data found for the YLR036c gene does not conclusively show a single function. The most promising data come from the nitrogen and histone depletion studies, where YLR036c is initially induced and later repressed. The pattern suggests that YLR036c is involvled in transcription, DNA synthesis, or DNA repair. Unfortunately, the correlation data was less conclusively. The YLR036c expressions were not found to consistently correlate with any class of genes, including those invovled in sporulation. For this reason, the earlier hypothesis that YLR036c specifically functions in a sporulation-specific process has been disregarded. Further studies will examine YLR036c as functioning in the repair, maintenance and duplication of genetic material.
References
1 Spellman PT, Sherlock G, Zhang MQ, Iyer VR, Anders K, Eisen MB, Brown PO, Botstein D, Futcher B (1998) Comprehensive identification of cell cycle-regulated genes of the yeast Saccharomyces cerevisiae by microarray hybridization. Mol Biol Cell 9(12):3273-97.
2 Chu S, DeRisi J, Eisen M, Mulholland J, Botstein D, Brown PO, Herskowitz I (1998) The transcriptional program of sporulation in budding yeast. Science 282(5389):699-705.
3 Gasch AP, Spellman PT, Kao CM, Carmel-Harel O, Eisen MB, Storz G, Botstein D, Brown PO (2000) Genomic expression programs in the response of yeast cells to environmental changes. Mol Biol Cell 11(12):4241-57.
4 Ferea TL, Botstein D, Brown PO, Rosenzweig RF (1999) Systematic changes in gene expression patterns following adaptive evolution in yeast. Proc Natl Acad Sci U S A 96(17):9721-9726.
5 Wyrick JJ, Holstege FC, Jennings EG, Causton HC, Shore D, Grunstein M, Lander ES, Young RA (1999) Chromosomal landscape of nucleosome-dependent gene expression and silencing in yeast. Nature 402(6760):418-21.
6 Sudarsanam P, Iyer VR, Brown PO, Winston F (2000) Whole-genome expression analysis of snf/swi mutants of Saccharomyces cerevisiae. Proc Natl Acad Sci U S A 97(7):3364-9.
Ben Whigham's Genomics Home Site.
Genomics Course Web Site.
© Copyright 2005 Department of Biology, Davidson College,Davidson, NC 28036
Send comments, questions, and suggestions to: bewhigham@davidson.edu