A Review of the L. bulgaricus Article
This website will review a PNAS article published by van de Guchte et al. in 2006. The article, which can be found here, analyzes the genome of a bacterial species, Lactobacillus bulgaricus, that is used in the fermentation of milk to produce yogurt. The authors state that humans have been producing yogurt for more than 5,000 years and suggest that over time L. bulgaricus has begun to adapt to the nutritionally rich milk environment in which it is kept for yogurt production. The evidence presented in this article suggests that L. bulgaricus is undergoing rapid evolutionary modifications that are the result of a relatively recent environmental change. The data to support the claim that L. bulgaricus is undergoing active evolution were convincing and can be boiled down to a few main points.
Firstly, the overall GC content of L. bulgaricus (49.7%) was significantly higher than that of the
closely related L. acidophilus (34.7%)
and L. johnsonii (34.6%). This fact
could be evidence of the L. bulgaricus
genome evolving to a higher GC content, especially given the fact that most of
the difference in GC content comes at the third codon position. The GC content
at the third codon position was 65.0%, significantly higher than the overall GC
content. Because of wobble
base-pairing and other factors, the authors claim that changes at the third
codon position typically occur faster than at the first and second positions.
Thus, higher GC content at the third position suggests that an evolutionary
change towards higher overall GC content is occurring in L. bulgaricus.
Because this bacterial species now exists in an extremely stable and nutritionally rich environment, it is reasonable to assume that it no longer needs many of the genes that it had once evolved in order to survive in a more unstable environment with fewer nutrients. The authors suggest that the bacteria had at one time evolved to survive in a plant-associated environment. A few genomic features provided evidence that this shrinking in genome size is actively occurring in L. bulgaricus. The authors claim that the ratio of RNA genes to genome size is surprisingly high and could be explained by a recent reduction in genome size. Additionally, lack of transcriptional regulators may be due to adaption to a stable environment where changes in gene expression are not as necessary. Finally, 270 pseudogenes were found in the genome, an unusually high number for an organism with a genome size of 1.8 Mbp. The authors point out that many of these pseudogenes are components of pathways that might have been necessary for survival in plant-associated environments (cellobiose, sucrose, maltose) but are no longer necessary for a milk-associated environment. The high prevalence of pseudogenes and the types of functions with which they are associated provide strong evidence that the L. bulgaricus genome is in an active state of size reduction, possibly through the loss of genes necessary for a plant-associated environment.
A final piece of evidence that suggests L. bulgaricus is evolving to a new environment is the existence of protocooperation between L. bulgaricus and Streptococcus thermophilus, another bacteria used in the production of milk. The leading hypothesis for how these two bacteria interact to more efficiently produce yogurt is that L. bulgaricus uses an extracellular protease to break down proteins in its surrounding environment, thus supplying the S. thermophilus (which lacks extracellular proteases) with amino acids. In addition to this form of protocooperation, the authors cite a few more metabolic pathways where one bacterium makes an enzyme that the other does not have, but needs. Protocooperation between these two species suggests that they have adapted their genomes to an environment in which they coexist. This argument lacks sufficient supporting data, though, and can be viewed as more hypothetical than the other pieces of evidence.
Overall this paper presents a convincing argument for the active evolution of L. bulgaricus. The main points made by the authors were strong and supported by data. Some arguments, however, were not as strong. Many claims were made in relation to metabolic pathways that were either present or absent in L. bulgaricus. These statements were fairly hypothetical and open to interpretation. Because they cannot be supported by a significant amount of data, their significance should be questioned. The authors also emphasized the importance of a large inverted-repeat region at the replication terminus (see Figure 6 below). They claimed that because features of this sort were extremely uncommon in bacteria, its presence could “be interpreted as a transient stage in genome evolution.” I thought that this was one of the weaker points of the article. While the presence of a large inverted repeat is notable, I did not feel that a sufficient explanation was given to link its presence in the genome to an active state of evolution. Regardless, of these weaker points, the other pieces of evidence put together a convincing claim that the L. bulgaricus genome is in the midst of evolutionary adaptations to the milky environment in which it is kept for yogurt production.
The figures below support the claims made in this article:
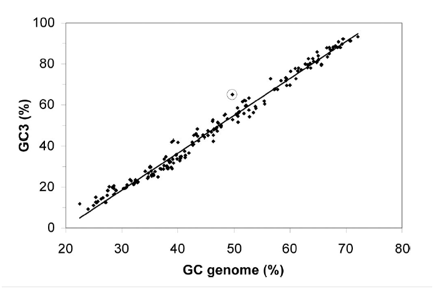
Figure 1 shows the GC content bias that exists at the third codon position. The x-axis represents the overall GC content of a given genome. The y-axis represents the GC content of the third nucleotide in all codons (GC3) for a given genome (pseudogene codons not included for L. bulgaricus). 232 different eubacterial genomes are plotted on the graph, with L. bulgaricus circled. The take away message from this figure is that overall GC content and GC3 are highly correlated in eubacterial genomes. However, in L. bulgaricus the GC3 is higher than would be predicted by the overall GC content. This is evidence the genome is evolving to have a higher overall GC content (see discussion above for more).
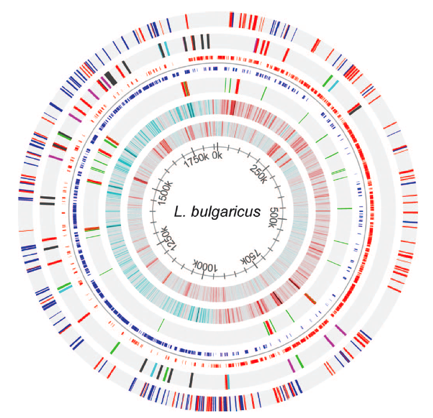
Figure 2 packs a lot of information about the genome of L. bulgaricus into one image. The innermost circle shows the coordinates along the genome. Moving out, circle 2 shows the GC content of the genome for a sliding window size of 500bps. Red bars represent sections of the genome that have a GC content > .7. Blue bars represent sections of the genome that have a GC content <.3. One possible feature of note is that the region from 250k-700k, which contain fewer pseudogenes and no IS elements, has a lower GC content. This area of the genome could be more conserved than the rest of the genome, and thus resist evolution towards a higher GC content. Circle 3 gives the GC skew of the genome for a sliding window size of 2000bp. Red bars represent areas with 10% more G’s than C’s on the positive strand. Blue bars represent areas with 10% more C’s than G’s on the positive strand. The sudden change in GC skew around at 0k overlaps with the dnaA gene, which is responsible for initiation of DNA replication. This suggests that this area is the origin of replication. On the opposite side of the chromosome, the sharp change in GC skew represents the replication terminus. This terminus is of note because it contains a 47.5 kb inverted repeat region (see Figure 6).
Circle 4 shows the RNA genes. tRNA genes are colored in green. rRNA genes are colored in red. RNA genes are of note for this genome because they have a higher than expected prevalence given the genome size (see Figure 3). Circle 5 shows the coding regions of the genome (not including pseudogenes). Positive strand coding regions are shown in red. Negative strand coding regions are shown in blue. Circle 6 shows the insertion sequence (IS) elements of the genome. It is of note that the region from 250k – 700k contains no IS elements. IS elements only account for 9 of the 227 pseudogenes (not counting transposase pseudogenes). The outermost circle represents the pseudogenes. Positive strand pseudogenes are shown in red. Negative strand pseudogenes are shown in blue. The authors note that pseudogenes are less prevalent from 250k-700k, although this trend is not completely obvious when looking at the genome map by eye.
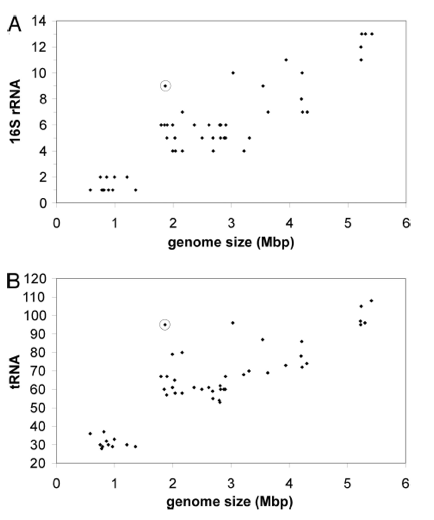
Figure 3 shows higher than expected prevalence of RNA genes in L. bulgaricus. Data points are taken from 54 different firmicutes, and the L. bulgaricus data point is circled. The x-axis represents the genome size of a given genome. In A, the y-axis represents the number of copies of 16s rRNA in a given genome. In B, the y-axis represents the number of copies of tRNA. Genome size is positively correlated with both rRNA and tRNA copies. However, L. bulgaricus appears to have a higher than expected prevalence of both tRNA and rRNA. The authors suggest that this is evidence that their genome has recently undergone a reduction in size.
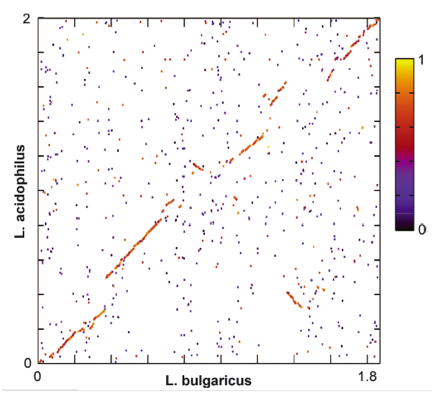
Figure 4 shows a global genome dot plot alignment between L. bulgaricus and the closely related L. acidophilus genomes. Areas with high alignment scores are marked in red/yellow. Areas with low alignment scores are marked in black/purple. Because of the high level of synteny, this figure suggests that the two species share a recent common ancestor. Based on this figure, claims about metabolic pathways that differ between the two species are more justified because they changes have occurred relatively recently.
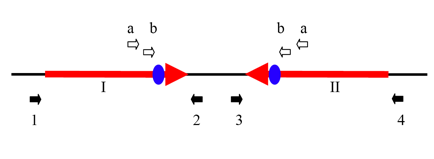
Figure 6 from the supporting materials shows the 47.5 kb inverted repeat that exists at the replication terminus. This region is conserved across individual bacteria, although the length of the inverted repeat varies. The repeat was verified by showing that the black region between I and II could be amplified with only primer a or primer b. To confirm that this inverted repeat could perform site-specific recombination (possible at the duplicated dif sites shown in blue), the authors showed through PCR that region I could be amplified by primers 1 and 2 or by primers 1 and 3. Likewise, region II could be amplified by primers 4 and 3 or by primers 4 and 2. This is certainly an interesting feature of the genome, especially given the size of the repeat, however the link to active evolution is not argued for sufficiently in the paper to justify this claim.
Genomics Page
Biology Home Page
© Copyright 2009 Department of Biology, Davidson
College, Davidson, NC 28035
Send comments, questions, and suggestions to: Will DeLoache