This web page was produced as an assignment for an undergraduate course at Davidson College.
"Synthetic Gene Networks That Count"
Friedland et al.
The paper: its ideas and claims
In this paper, Friedland et al. describe two methods to construct synthetic gene counters. They describe a counter as “a key component in digital circuits and computing that retains memory of events or objects, representing each number of such as a distinct state. In their study they constructed two different counters that have the capability of counting up to three. The first counter they created was the riboregulated transcriptional cascade (RTC) counter. This counter is based on transcription cascades and is capable of counting cellular events on the time scale of cellular division. In this counter they used a constitutive promoter (PLtet0-1) that drive transcription of T7 RNA polymerase, which in turn promotes the transcription of green fluorescent protein (GFP). The second counter, DNA invertase cascade (DIC) counter, is a little more complicated. They chained together modular DNA counting units that were capable of flipping by the use of restriction enzymes. Once one counting unit is activated, it flips, activating the second, in turn, activating the third to once again produce GFP. They actually developed two different types if DIC counters, one with all the same promoters, and another with three different promoters. They termed these single-inducer DIC and multiple-inducer DIC respectively.
Once the constructs were made, they made sure their counting system worked by “pulsing” (adding inducer) E. coli transformed with the RTC or DIC plasmid. They found that their counting system did work so then they quantified the ideal pulse length and interval using Flow cytometry. The interesting part about the two different counters is that they have drastically different ideal pulse lengths and intervals. Friedland et al. close by listing uses for each counter including programmed cell death after a specific number of cell divisions with the RTC counter, or studying sequential biological events like development and gene cascades with the multiple-inducer DIC counter. Now that we have a basis for the Friedland et al. did lets look at the figures to make sure we believe their claims based on the data they produced.
The figures: what they show and what they mean
Figure 1.
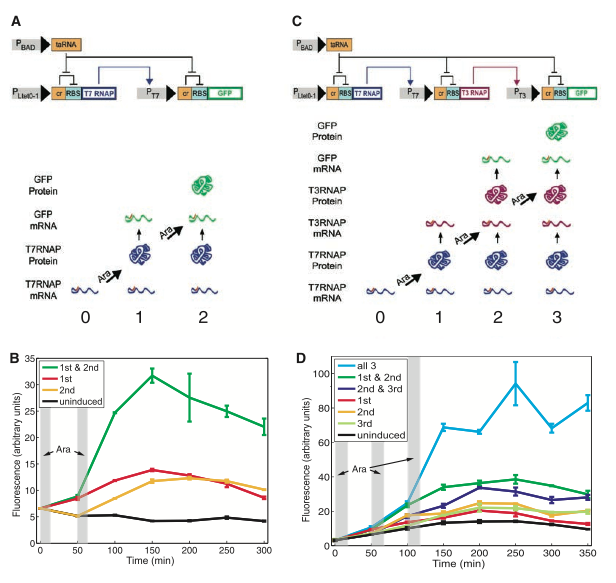
Figure 1. Figure one shows the construct of the RTC counters that can count to two (1A) and three (1C). Both constructs are very similar the only difference being that they put the T3 RNAP (a different RNA polymerase gene) downstream of the T7 promoter instead of GFP and then they put the GFP gene downstream of the T3 promoter, essentially adding a third finger to count on. The promoters are depicted by grey boxes with black arrows to the right of them. You can see that the Pbad promoter is upstream of the taRNA gene that inhibits the cis-repressor sequence (cr). The purpose of the cis-repressor sequence is to repress the expression of the downstream gene (T7 RNAP) by preventing the binding of the 30S ribosomal subunit to the ribosomal binding site (RBS). The schematic in 1A depicts a mechanism that is induced by arabinose (Ara), which binds to the Pbad promoter inducing translation of taRNA. This inhibits cr activity and the Plte0-1 (a constitutively on promoter) causing the binding of the 30S ribosomal subunit and the transcription of T7 RNAP. The protein produced by T7 RNAP then binds to the Pt7 promoter and induces GFP transcription. It is important to note that there are crs after all the promoters. This allows for each pulse of Ara to only complete one step of GFP protein production. This is depicted in the picture below the constructs where the numbers indicate the Ara pulses and the pictures are labeled by the words to the left. Figure 1C is very similar; the only difference is there is a third step added.
Figures 1B and 1D show fluorescent results for the two count or three count constructs respectively. Here they transformed a high copy plasmid of each construct into E. coli and pulsed the cells with Ara either 2 (1B) or three (1D) times and measured fluorescence over time. They different lines on the graph represent which pulse (gray bars) the cells got. Notice how only the cells the received both (or all three in 1D) pulses showed a significant increase in fluorescence. The researchers explain the increase of fluorescence for the control cells as a result of leakage. This data, in my eyes, shows that constructs are doing their job. So far so good.
Figure 2.
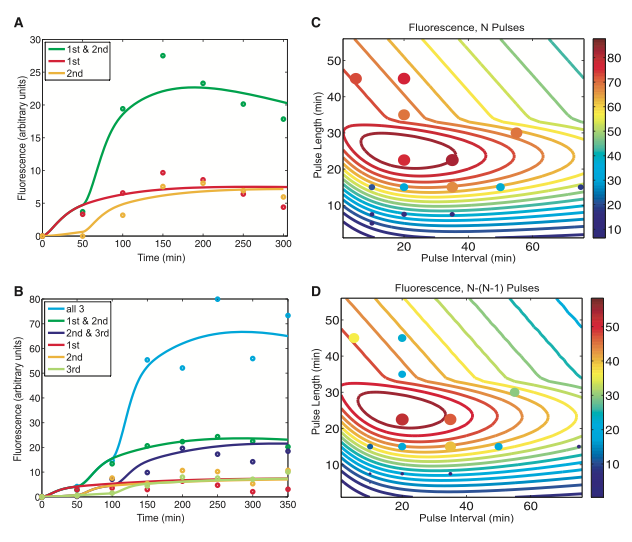
Figure 2. Figure 2A and B represent mathematical models with fitted parameters the researchers made based off the initial reading from figure 1B and D. Once again the lines represent which treatment (1st pulse, 2nd pulse, or both) the cells received. The dots represent actual experimental data. Figure 2C models various fluorescence based on pulse length and interval using the parameters set by 2B. The colorful contour lines represent the amount of expression of GFP in relation to the scale on the right. 2C shows that the ideal pulse length is between 20 and 30 minutes and the ideal pulse interval is between 20 and 40 minutes. This looks promising, but when we look at the dots that represent actual data, you see that there are dark blue dots on yellow lines. Yellow represents 3 times the expression of dark blue! It looks to me like their contour lines need to be adjusted. Figure 2D is a model of the expression of the three-counter RTC when the expression of after the second pulse is subtracted from the expression of the third pulse. There are two things I don’t like about this image. First, the colors are the same but the scale is different, and second; the dots do not match up with the contour line again. Overall I found these models to be less than satisfactory. Lets see how they fair with the DIC counter.
Figure 3.
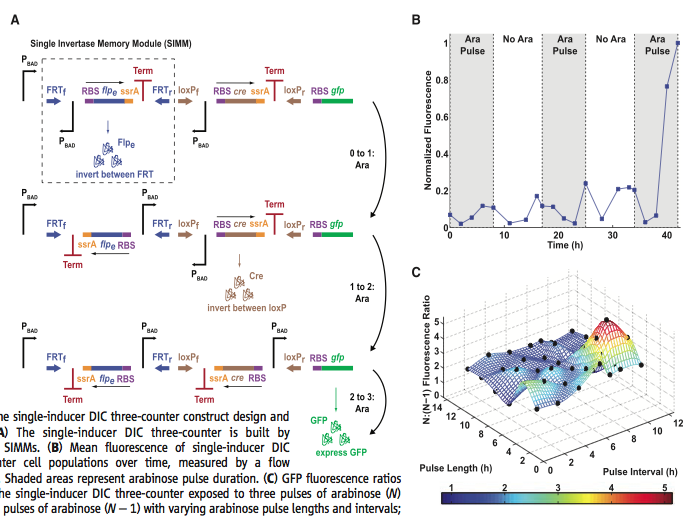
Figure 3. Figure 3A looks like an intimidating image. However, once you know the pieces and the logic behind the picture, it becomes clear what the researchers are trying to depict. Lets look at the parts and piece the whole picture together. The black hooked arrow represents the same Pbad promoter from the RTC counters. Notice there is one promoter orientated in the correct direction and two that have the incorrect orientation. Next we have the colored arrows. These represent the two recognition sites for flpe (blue arrows) and Cre (brown arrows) recombinases. Notice that for each recognition site, there is a forward (FRTf/loxPf) or reverse (FRTr/loxPr) site. Next we have what is called the single invertase memory module (SIMM). This consists of the inverted promoter, with a downstream recombinase gene (flpe or cre) preceded by a ribosome binding site, followed a ssrA tag that induces rapid protein degradation and finally a termination site. Now that we have an understanding of all the working parts, we can go through the process by which this system works. Think of each row of figure 3A as a different pulse, 1, 2, or 3, of Ara. In the first pulse, we see that the Flpe recombinase is produced. This causes the first SIMM (in the dashed box) to flip. Now the inverted promoter is in the correct orientation. At the instance of the second pulse, the cre recombinase is produced and the second SIMM is flipped between the loxP sites. Now all three promoters are in the correct orientation to produce GFP with the third pulse. The recombinases are not produced because they are now in the incorrect orientation. I personally like this counter system better because of the ingenious design. After this system was made the researchers put them on pBAC plasmids and maintained them as single episomes. Once again the researchers tested their counter by exposing cells to Ara pulses. In figure 3B you can see that after the third pulse there is a large increase in fluorescence. The researchers did note that there was premature flipping of the cre SIMM causing background fluorescence, but it was not significant compared to the fluorescence after all three pulses. Figure 3C is very similar to figure 2D. Here they investigated the GFP fluorescence ratios between the three-counter DIC system and the two-counter DIC system in relation to pulse interval and pulse length. Once again the colors represent relative fluorescent ratios. The researchers claim the ratios do not fall below 1.5 for the most part, indicating that the DIC counter is capable of counting pulses with lengths and intervals between 2-12 hours. The black dots represent experimental data. I wonder how many times they reproduced each pulse and length interval because the graph seems a little wavy. I would expect this graph to depict a design similar to the contour lines in figure 2D. The difference may be due to the fact that they are using two different counting mechanisms. I think it would have been beneficial to include a contour line graph for direct comparison between both the RTC and DIC counting systems.
Figure 4.

Figure 4. The next step in Friedland et al.’s experiment was to produce and test a “multiple-inducer” DIC three-counter. The difference between the single- and multiple-inducer counters is the promoter used. In the single-inducer counter there are three of the same promoter (Pbad) used. In the multiple-inducer counter there are three different promoters used. Figure 4A depicts the subtle differences between the multiple- and single-inducer counters. Notice almost everything is the same except the promoters used. The first promoter is PLte0-1, induced by anhydrotetracycline (aTc). The second promoter is still Pbad, induced by Ara, and the third promoter is PA1lac0, induced by IPTG. The researchers once again tested their new counter, but this time they used every combination of inducer for each pulse, depicted by the chart in figure 4B. The graph in figure 4B shows the only combination that produces significant fluorescence (measured by flow cytometry) correlates the correct order of the promoters (aTc, Ara, IPTG). Once again there is leakage seen but it is not significant to disrupt the results. Figure 4C shows flow cytometry data for single inducers compared to the correct sequence of all three inducers. Notice how all the single induced cells show similar fluorescence to cell that were not induced at all, whereas, the cells treated with the correct sequence of all three inducers show a marked increase in fluorescence. It is also important to note that some cells that were treated with a single inducer did show fluorescence (the little peaks under the main blue peak) once again indicating leakage. Figure 4D is similar to 4C. The only difference is they compared the different combinations of two inducers to the correct sequence of all three inducers. Here we see similar results to 4C, but the peaks that indicate leakage seem to be bigger. To me, this indicates that the higher the system is designed to count, the more leakage there is and therefore the data may be lass reliable.
Closing Remarks and Referencess:
Friedland et al. have produced a seriously interesting paper. There are many possible applications for the two counting systems they have created. The only problem I see is the constant leakage that seems to increase when cells are induced more. There seem to be limitations to these counting systems. Furthermore, some of their data about the ideal pulse length and interval are a little sketchy. Overall, this paper is pretty convincing and I definitely believe they have created counters that work, we just don’t know how applicable they are for future studies.
Genomics Page
Biology Home Page
Email Questions or Comments to Joholzwarth@davidson.edu
© Copyright 2011 Department of Biology, Davidson College, Davidson, NC 28035