This web page was produced as an assignment for an undergraduate course at Davidson College
Song et al. Figure 4
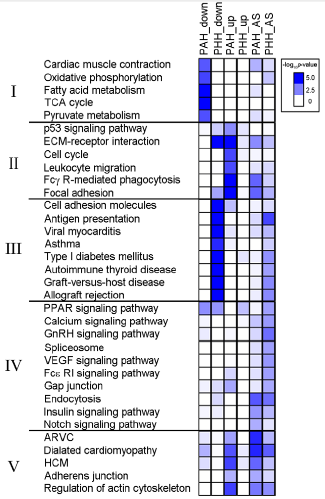
Figure 4. A list of significantly altered pathways (5 or more DEGS or 5 exon variants) in cardiac hypertrophy. Pathways are grouped as follows: I) muscle contaction ad metabolism, II) immune function and cell cycle, III) autoimmunity, IV) cell signaling, and V) cardiac disease. The heatmap characterizes the degree of up or down regulation in PAH and PHH conditions, as well as the degree of alternative splicing in each condition. Color intensity is a log-based measurement of the p-value for differential gene expression or differential splicing pattern.
Image reprinted under a Creative Commons license from Song et al. 2012