This web page was produced as an assignment for an
undergraduate course at Davidson College.
Song, et
al.'s"Deep RNA Sequencing Reveals Novel Cardiac Transcriptomic
Signatures for Physiological and Pathological Hypertrophy"
Figure
1
This figure provides an overview of quantities of genes that
differ within and between different experimental groups of mice (notably
between PAH and PHH models), and how these genes were differentially
expressed. Information reported therein was obtained through high-throughput
RNA sequencing of cardiac cells from three different mice in each model.
 Part
A of this figure provides a visual representation of the differentially
expressed genes, within the
cardiac tissue of each of four experimental groups of mice.
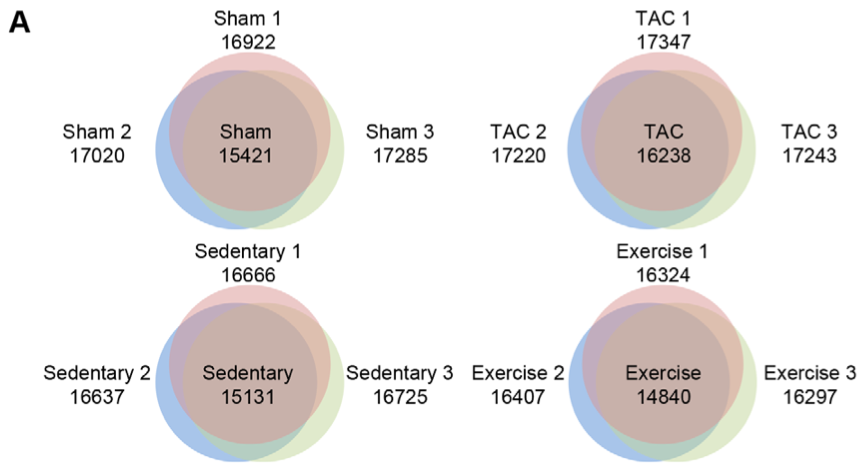
Part
A of this figure provides a visual representation of the differentially
expressed genes, within the
cardiac tissue of each of four experimental groups of mice. Within
sham mice, for example (upper left Venn diagram), different numbers of
genes were expressed in different individuals (labeled Sham 1, 2 and 3,
with corresponding circle color and numbers of genes expressed); the
number of genes expressed in common to all of those individuals in shown
in the middle of the corresponding Venn diagram where all circles overlap.
This panel visualized the relatively high similarity of gene
expression within experimental groups.
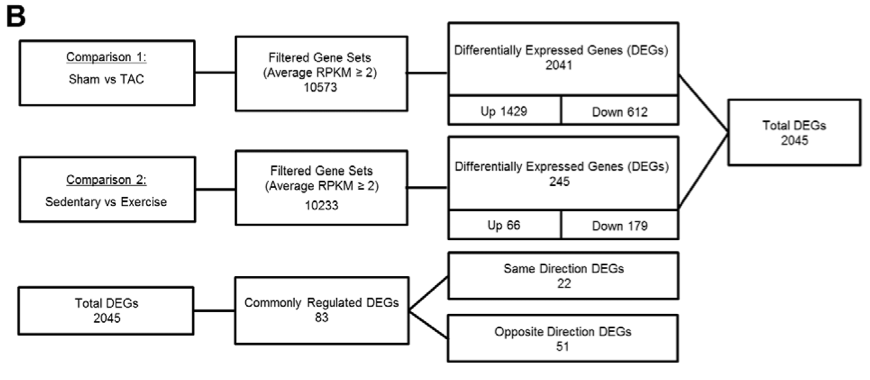
Boxes including "filtered gene sets" (filtered to include
genes appearing at RPKM ≥ 2) note the numbers of genes expressed in both
groups combined in the corresponding comparison. Differentially
expressed genes between the two groups of a comparison, subdivided
into up-regulated (Up) or down-regulated (Down) genes in in each comparison
are noted in the third column. Notably,
70% of the DEGs were up-regulated in the PAH comparison while
73% of DEGs were down-regulated in the PHH comparison.
Of these 2045 different DEGs in PAH and PHH models
(accounting for overlap in genes expressed), a fraction (83) were regulated
in the same fashion (e.g. up-regulated in both the PAH and PHH model). The
genes of opposite regulation were of interest and explored further in the
study, as those were taken as the most likely candidates for contributors
to the differential tissue health in PAH versus PHH.
This figure provides only an overview of the information
found in the study; further analyses of patterns among the expressed genes
is necessary to identify meaningful interactions. This further analysis
begins in Figure 2.
References
Cha H, Kim
JM, Oh JG, Jeong MH, Park CS, Park J, Jeong HJ, Park BK, Lee YH, Jeong
D, Yang DK, Bernecker OY, Kim do H, Hajjar RJ, Park WJ. (2008). PICOT is
a critical regulator of cardiac hypertrophy and cardiomyocyte
contractility. Journal of Molecular and Cellular Cardiology, 45(6),
796-803.
Song,
H. K., Hong, S. E., Kim, T., Kim D. H., et al. (2012). Deep
RNA sequencing reveals novel cardiac transcriptomic signatures for
physiological and pathological hypertrophy. PLoS One, 7,
e35552.
Return
to Garrett's Home Page
Genomics
Page Biology
Home Page
Email
Questions or Comments to gasmith@davidson.edu.
© Copyright 2013 Department of Biology, Davidson
College, Davidson, NC 28035