This web page was produced as an assignment for an undergraduate course at Davidson College.
Structural Systems Biology
Evaluation of Metabolic Thermotolerance in Escherichia coli
Image Courtesy of Popular Science
In this study Chang et al. conducted research on metabolic thermotolerance of the bacteria Escherichia coli, otherwise known as E. coli. Chang et al. relied on structural systems biology to identify proteins involved in E. coli’s thermosensitivity. Using genome-scale network reconstruction as a basis, the group introduced protein structure data to create new model, GEM-PRO. Genome-scale network reconstruction has previously proven useful in analyzing and predicting the metabolism of an organism. These reconstructions use genomic data and information on metabolic reactions to create a model for the interaction of genes and metabolism. An organisms’ metabolism includes all chemical reactions that are occurring within that organism to maintain life. Key proteins that are required for proper metabolism are enzymes, which are catalyzers for chemical reactions. At high temperatures protein strucures are compromised. Given that protein function is highly dependent on structure and the folding of the polypeptide chains, any disruption in the proteins structure will prevent its proper functioning.
With the knowledge that protein structure is an important part of protein function, Chang et al. sought to use this model to understand where and when structural changes in E. coli proteins were taking place in response to increased temperature. Metabolic thermotolerance was therefor evaluated as a function of protein thermosensitivity. Meaning that the thermotolerance of the entire metabolic network was assumed to be dependent upon the thermotolerance of the proteins that comprised the network. Using this assumption, proteins that were found to be heat sensitivity were deemed heat-limiting factors for the network. Understanding the exact points of thermosensitivity within the metabolic network would allow for future research to be conducted on ways to increase thermotolerance or maintain normal bacterial growth at above optimal temperatures.
Overall the E. coli GEM-PRO model sought to understand how metabolic processes are altered by heat, and to understand the growth limiting factors that were at work in this network. Furthermore, the researchers sought to find mutations in genes and gene regulators that might confer thermo resistance.
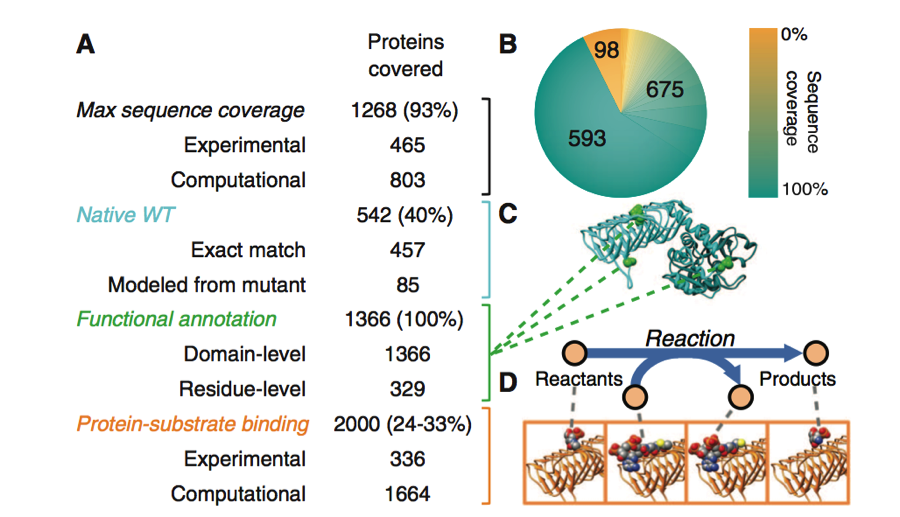
Figure 1. Part A
This figure abive provides information on how the protein structures included in the model were constructed and annotated. Each protein of interest involved in this study was associated with its proper amino acid sequence and structure. Protein structures were determined experimentally and with homology modeling. Together these methods gave 93% maximum sequence coverage of the proteins used to build this model. Homology modeling is the construction of a protein of interest using the structure of a related homologous protein and the protein of interests' sequence. This process is made possible due to the conserved protein structures found between homologues. Experimental and homology modeling were again employed to determine protein-substrate binding of between 6144 and 8448 gene pairs. This achieved a total of 24 to 33% coverage of the protein-substrate binding confirmation.
The native WT structures of the proteins were also included in this model. Of the 1366 proteins represented in the model, 457 had their native structures defined by exact match through protein databases. Another 85 models were found after homology modeling was retouched to replace mutated amino acids. Functional Annotation at the domain or residue level was accomplished for 100% of the proteins.
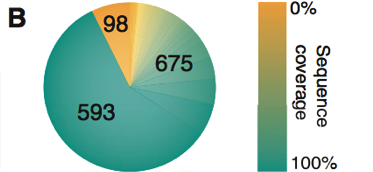
Figure 1. Part B
In part B shown above a graphical depiction of the distribution of the percent amino acid sequence coverage of the proteins included in the model is given. The color distribution index on the right shows the percent sequence coverage. As is seen, 593 proteins had 100% sequence coverage. There also were 675 proteins that had a coverage range of about 10% to 90%. There were 98 proteins with 0% coverage.

Figure 1. Part C
Part C provides a sample structure for a wild type protein that has been functionally annotated. This wild type protein is highlighted at locations where it has an annotated functional site. This means that at this particular site, the biological function of this sequence or domain has been identified and the protein is functionally annotated.
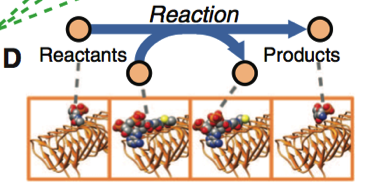
Figure 1. Part D
This diagram shows a reaction taking place where protein and substrate binding is catalyzing the reaction. Protein-substrate binding refers to the interactions of a protein with the reactants or products of the metabolic reaction that is occurring. In order to understand protein-substrate interaction, the model needs to have proper functional annotation and protein structure built into it.
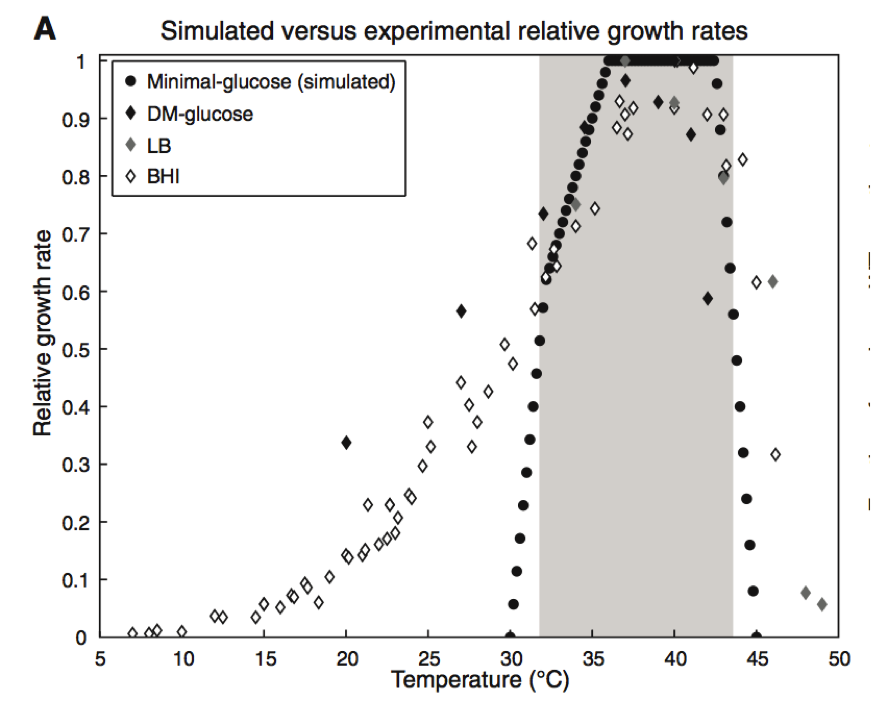
Figure 2. Part A
This figure includes data collected through traditional wet lab experiments and through predictions computed through GEM-PRO model. Four different conditions were compared for the effect on the relative growth rate of E. coli. Relative growth rate was determined by comparing each set of data to the maximum growth rate of the bacteria. The three diamond shapes of varying shade shown on the graph represent the different media in which the E. coli growth rate was followed during wet lab experiments. Davis minimal medium, (black diamond), lysogeny broth (gray diamond), and brain heart infusion (open diamond) were the three media. Chang et al. took into account three dimensional protein structure and protein melting point in their simulations. Using their model they were able to produce the data shown in dark circles on the graph. In this simulation, the E. coli cells were grown on mini-glucose medium. The simulated data has a narrower window of growth and a much sharper slope in its growth rate when compared to the experimental data collected. Despite this difference, the area of maximum growth is similar in simulated model and three experimental conditions. It appears that at temperature between 34 and 44 degrees Celsius the bacteria in all conditions experienced the greatest rate of growth. Additionally, this graph shows that Chang et al. were able to produce a model that overall accurately predicted the maximum growth rate in E. coli, something that is of use to the reader when continuing their examination of this paper.
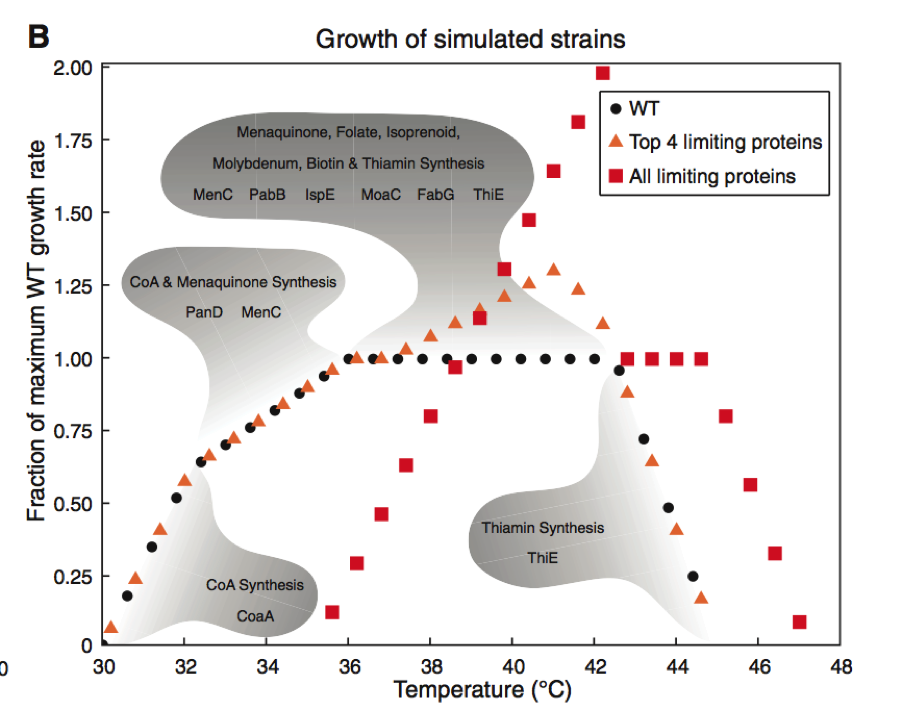
Figure 2. Part B
This section of Figure 2 focuses relies entirely on simulated experiments to produce its data on the growth of the three E. coli strains. The data points in this figure are produced by comparing the strain of interests’ growth to the maximum growth rate of the WT strain of E. coli. This is referred to as the fraction of maximum WT growth rate, as is shown on the Y-axis. The WT growth rate of E. coli is also included in the graph and is shown in dark circles. This strain reaches 1.00 (meaning maximum growth rate of the WT) at temperatures between 35 and 43 degrees Celsius.
Then Chang et al. identified the four proteins implicated in thermosensitivity. These four proteins were termed “growth limiting” as their lack of thermo stability at higher temperatures limited the growth rate of the bacteria. By altering these four proteins to be stable at 42.2 degrees Celsius, the researchers wanted to see how the cell growth would change without the constraint of these previously thermo sensitive protein. This increased threshold for temperature tolerance in these four proteins lead to an increase in the growth rate of E. coli at temperatures between 39-43 degrees. Growth rate was unaffected at temperatured outside of this range and remained consistent with the WTstrain.
The researchers then took this method a step further and optimally increased the critical temperature of all proteins found to be growth limiting at 42.2 degrees Celsius. Without this constraint, cell growth doubled at 42.2 degrees Celsius. However, altering these proteins caused this bacteria strain to have diminished growth rates at temperatures below 38 degrees. Therefor maximal growth rate was increased but this caused reduced growth at lower temperatures compared to the WT strain of E. coli. In the gray shaded regions of the graph, one can see the growth-limiting protein predicted to be at play at that given temperature range. Simulations were an important tool in this experiment as it allowed the researchers to collect a greater amount of data while avoiding having to create genetically altered strains of bacteria.
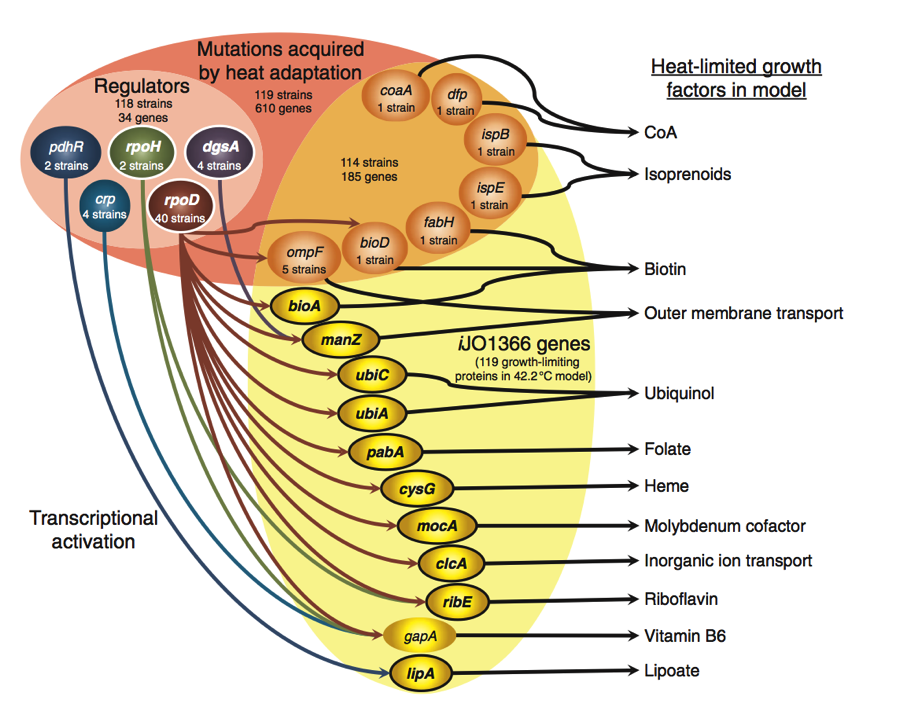
Figure 3.
This figure encompasses all of the predicted mutations and gene regulation mechanisms that would lead to a thermo tolerant strain of E. coli. The upper portion of Figure 3 shows a pink oval in which there are two different shades, orange (right) and pink (left. The mutations included in the upper portion of the diagram are mutations found in 119 different E. coli strains that confer heat adaption. Heat adaption was selected for using laboratory evolution experiments. Of these 119 strains, 118 strains carry a mutation in a regulator. In addition, 114 strains had a mutation in one of seven different metabolic genes shown in the orange portion of the oval.
Gene regulators (light pink) were included for they contained mutations that altered their ability to regulate their target genes. As is shown by the arrows running from the regulators to the metabolic genes, mutations in regulators could affect protein and metabolic activities at high temperatures. Such mutations could up the expression of certain heat limiting proteins and cause the bacteria to achieve thermotolerance.
The right portion of the diagram depicts metabolic gene mutations found to confer heat tolerant E. coli strains (orange). These seven genes are interesting in that WT expression of these genes does not change in response to heat exposure. Coversely, he 11 iJO1366 genes have heat-induced transcription in WT strains, implicating them as possible targets for regulators. The arrows pointing out to the right of the genes show the predicted heat-limiting growth factors that are affected by reduced protein activity that is caused by heat increases.
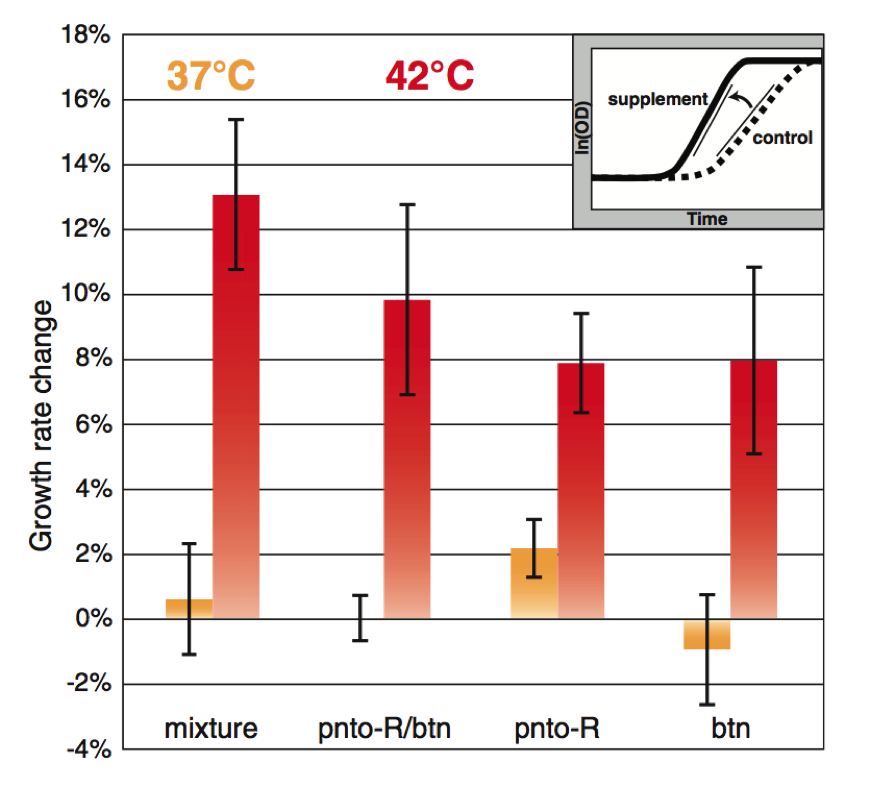
Figure 4.
In Figure 4 Lang et al. sought to increase the thermotolerance of E. coli through supplementation. Using simulations, proteins were identified as heat sensitive and metabolites produced downstream from these proteins were found. These metabolites produced downstream of the proteins of interest can serve as supplements for said protein in E. coli. These supplements would theoretically be able to provide the metabolic support at high temperatures that the heat sensitive proteins normally would at lower temperatures. By providing these metabolites to the bacteria they could bypass the heat limiting factors, heat sensitive proteins. These proteins were provided in a mixture to the E. coli at both 37 and 42 degrees Celsius. Growth rate change was calculated by taking the maximum slope of the growth curve. The growth curve was calculates as a fraction of the experimental condition to the control condition. The total mixture of supplements caused the greatest degree of growth rate change at 42 degrees Celsius, indicating it benefited the cell at higher temperatures. At 37 degrees Celsius no benefit was provided by these supplements.
Two metabolites were then isolated as causing the highest growth rates at 42 degrees Celsius. Panthothenate (pnto-R) and biotin (btn) were tested in synchrony and individually on the bacteria. Together they increased E. coli’s growth rate, though they did not match the growth seen when exposed to the entire mixture of nutrients. Individually both metabolites increased the growth rate of the bacteria at 42 degrees Celsius.
This study is significant in at least the intention of its methods as it sought to integrate protein structure into their model of network reconstruction, an approach not previously employed and of great promise for the scientific and medical community. I think this was a lofty goal and this type of model could prove useful in an array of different studies. I am however disappointed the amount of information that was left off of the main paper. Understanding how the model was constructed was not possible for me without the supplemental information, which was referred to several times in this paper. I feel that brevity is important in short articles such as these, but I also feel that the authors left off too much knowing that they would submit supplemental information. Supplementary material is a useful took for researchers, but in this situation I find it granted the researchers the ability to sidestep the task of finding a way to briefly/concisely explain their complicated processes.
I liked that early on in the paper Chang et al. compared wet lab data to their simulated data and showed that the two had a great deal of agreement. This is important in establishing validity early on in the paper. Considering that the research is largely based on simulated data, it is important that the reader is able to trust the validity of this data early on, and is able to read the rest of the paper without second guessing the model. Finally, I did apprecitate their use of figures, I thought they were interesting though at times confusing.
References:
Chang et al. Structural Systems Biology Evaluation of Metabolic Thermotolerance of Escherichia coli. Science 340: 1220-1223 (2013).
Genomics Page
Biology Home Page
© Copyright 2014 Department of Biology, Davidson College, Davidson, NC 28035