This web page was produced as an assignment for an undergraduate course at Davidson College.

Conserved epigenomic signals in mice and humans reveal immune basis of Alzheimer's disease
(Gjoneska et al. 2015)

Summary:
   

    Gjoneska et al. aimed to characterize the epigenetic changes which underlie alterations in gene regulation resulting in neurodegeneration associated with Alzheimer’s disease (AD). The researchers discuss that much of this work has not been performed due to the inaccessibility of human brain samples but solve this problem with their model organism: CK-p25 mice, for which accumulation of the p25 Cdk5 activator protein is inducible and which demonstrate an AD-like phenotype. The researchers collected both transcriptomic and epigenetic data to compare gene expression and chromatin modification in CK-p25 mice and CK littermate controls at both early and late stages of neurodegeneration (2 weeks and 6 weeks following induction of p25 accumulation in CK-p25 mice). The researchers sought to investigate possible mutations leading to epigenomic modifications which may contribute to gene-regulatory changes previously identified as associated with AD.

            To analyze the transcriptome, the researchers performed RNA sequencing at both the 2-week and 6-week time points and characterized the upregulated and down regulated genes into three categories: transient (differentially expressed only at the 2-week time point), late-onset (only at the 6-week time point) or consistent (differentially expressed at both time points). The researchers analyzed common functions and gene ontology (GO) terms associated with the genes in each category to possibly uncover coordinated transcriptomic regulation of processes which may contribute to the pathophysiology of AD.

            To analyze the epigenome, the researchers employed chromatin immunoprecipitation sequencing (ChIP-seq) to detect seven chromatin marks throughout the genome, before focusing their analysis upon H3K4me3 marks to identify active promoters within promoter chromatin regions and H3K27ac marks to identify active enhancer regions within enhancer chromatin states. The researchers identified regions with increased or decreased levels of either H3K4 trimetlylation (H3K4me3; promoter regions) or H3K27 acetylation (H3K27ac; enhancer regions). In addition, in a similar fashion to their characterization of transcriptomic changes, the researchers also profiled these altered-level epigenomic marks as transient, late-onset, or consistent. Combining their temporal observations with thorough, genome-wide epigenomic and transcriptional profiling the researchers established sufficient data from which they could draw conclusions about coordinated changes in gene regulation to investigate the mechanisms of AD.

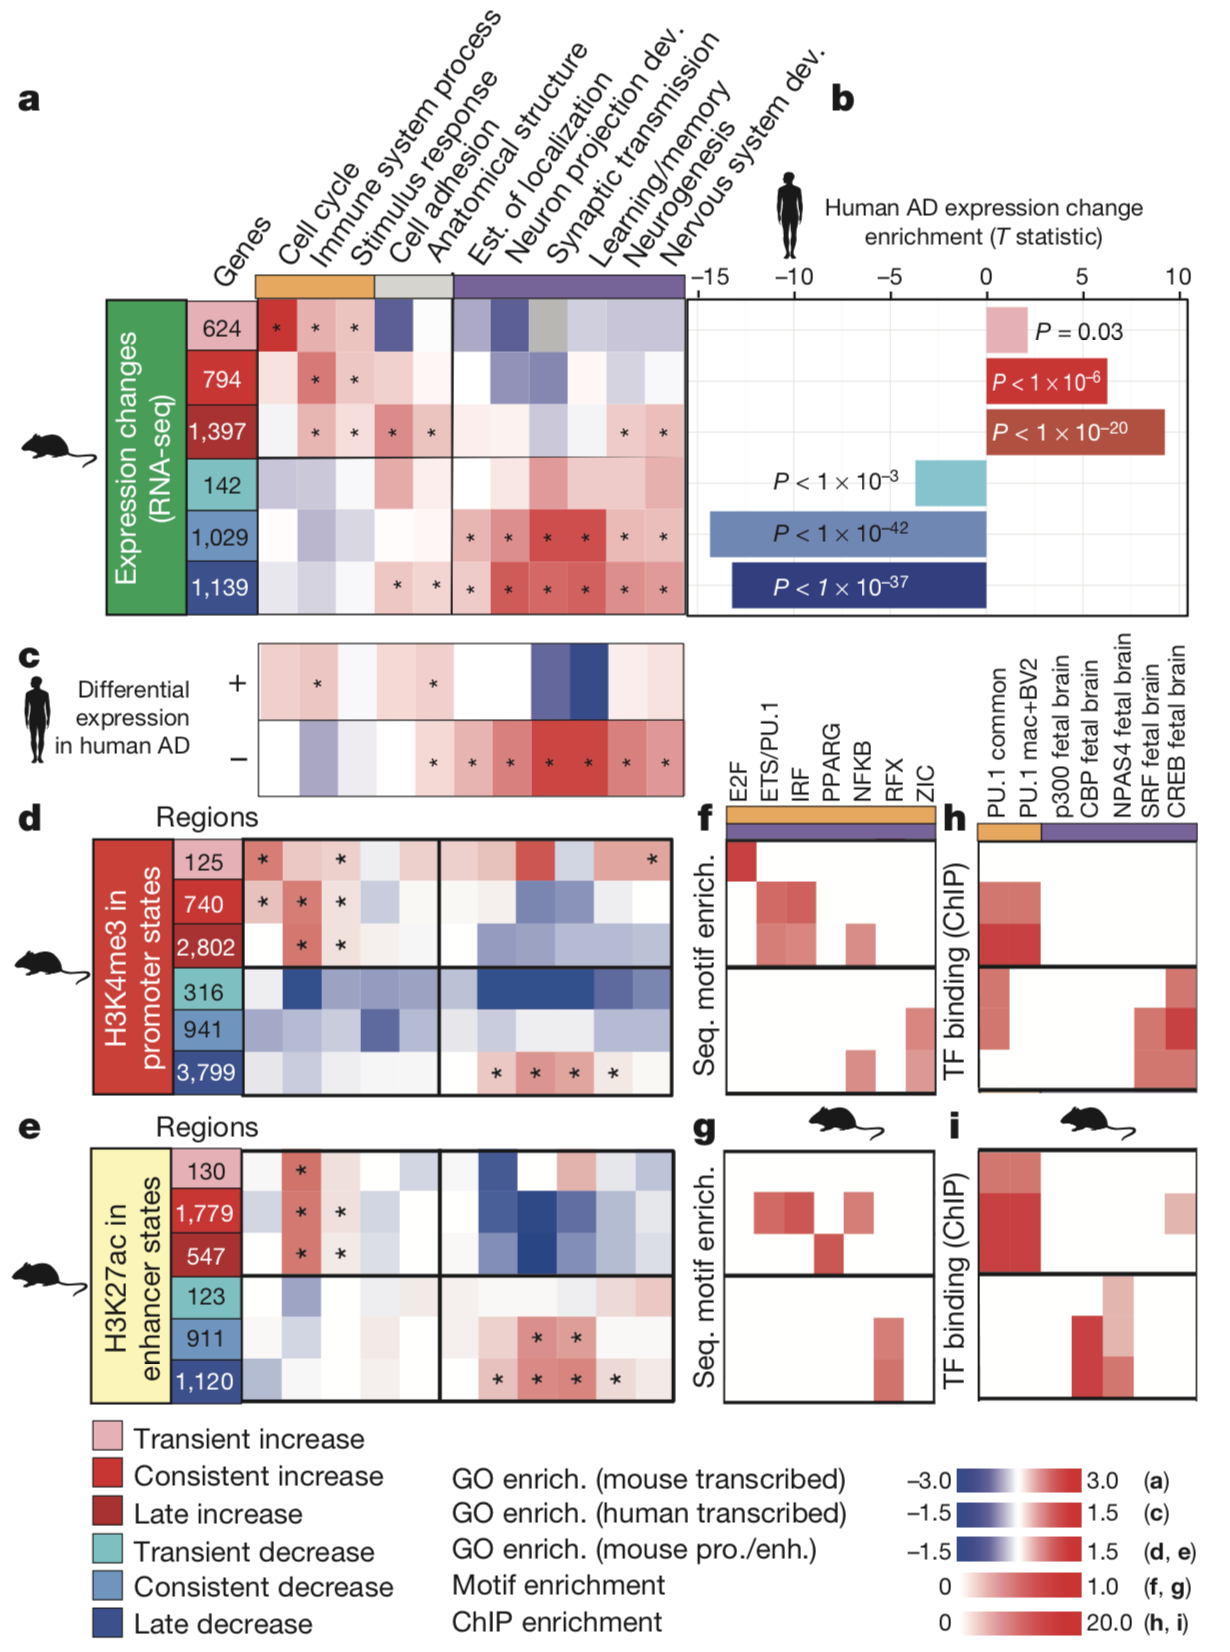
            The researchers found consistent trends in gene ontology analyses between their transcriptomic and epigenomic data. These results included concordance of transcriptomic upregulation and adjacent increased-level promoter or enhancer regions with genes involved in immune and stimulus response functions among CK-p25 mice relative to CK littermate controls. Additionally, the results indicated concordance of transcriptomic downregulation and adjacent decreased-level promoter or enhancer regions with genes involved in synapse and learning-associated functions.

            Having observed transcriptomic and epigenetic changes broadly, the researchers shifted their focus to the transcription factors which bind the epigenetic regions they identified in order to regulate transcription. The researchers found distinct and consistent transcription factor motifs and binding patters for both increased- and decreased-level regulatory regions. Increased-level promoters and enhancers demonstrated binding of transcription factors known to regulate genes involved in immune functions. Conversely, decreased-level promoters and enhancers demonstrated binding of transcription factors known to regulate neuronal activity.

            Next, the researchers assessed the reproducibility of their observations in humans. In one experiment, the researchers assayed the ability of human transcription factors orthologous to those which bound to increased-level enhancer regions to drive in vitro gene expression in mouse cell line models of brain-specific immune cells and neuroblastoma cells. The data from this experiment indicated the majority of human transcription factors tested could drive in vitro gene expression. These results demonstrate functional conservation of the increased-level enhancer regions observed in AD mice.

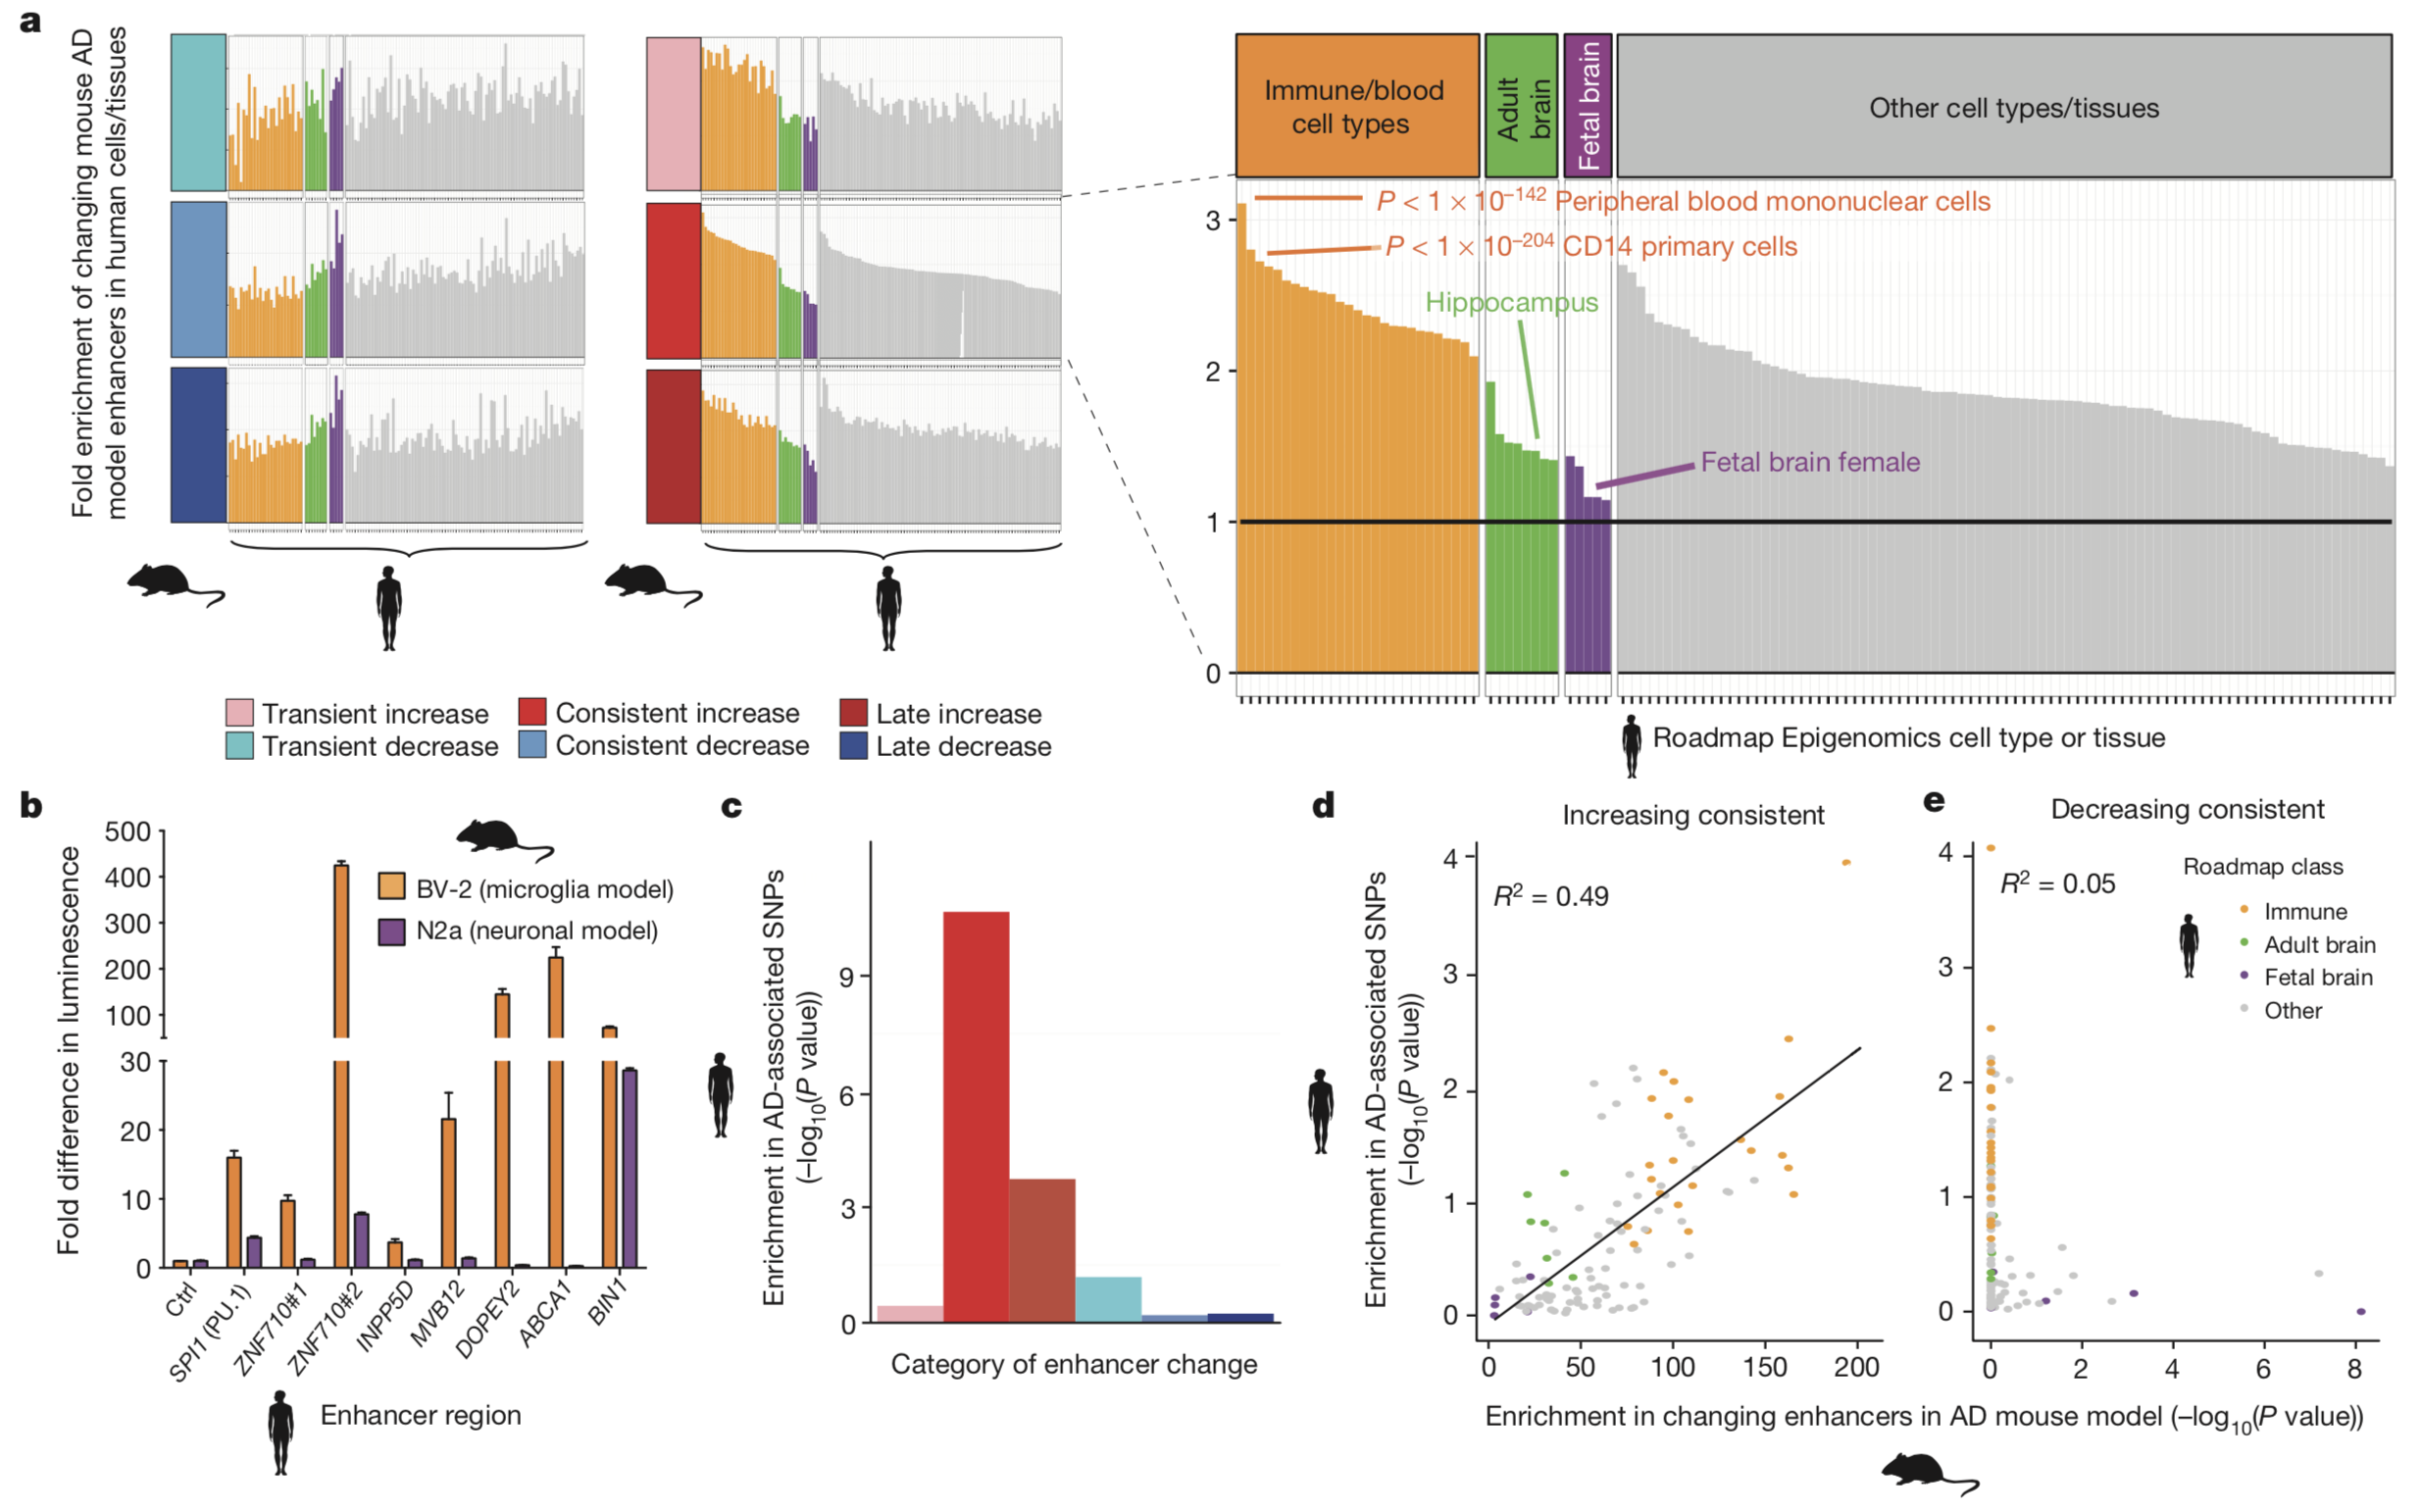
The researchers next examined a possible causal relationship between the changes in regulatory regions they observed in CK-p25 mice and AD in humans. The researchers first assessed the enrichment for human AD-associated single nucleotide polymorphisms (SNPs) found in genome-wide association studies (GWAS) in increasing-level and decreasing-level regulatory regions and found significant enrichment for AD-associated SNPs in both consistent- and late-increasing enhancers, while promoters demonstrated only weak enrichment at any time scale. These results suggest variants in distal enhancer sequences, rather than in adjacent promoters, are associated with AD predisposition.

The researchers then narrowed the cell types in which these effects mediate AD phenotypes by investigating concordance between enrichment for human AD-associated SNPs and enrichment for consistently increasing-level and consistently decreasing-level enhancer orthologues in diverse human cell types and tissues. Consistently increasing-level enhancers demonstrated a positive correlation with human AD-associated SNPs (R2 = 0.49), but consistently decreasing-level enhancers only showed a very weak correlation (R2 = 0.05). It was apparent in these data that human immune cell types demonstrated higher enrichment for both human AD-associated SNPs and consistently increasing-level enhancers than any other type of cells, including neuronal cells. These results implicate that genetic predisposition to AD is primarily attributable to immune functions, rather than neuronal functions, which may be impacted by other factors such as aging and environmental influences.
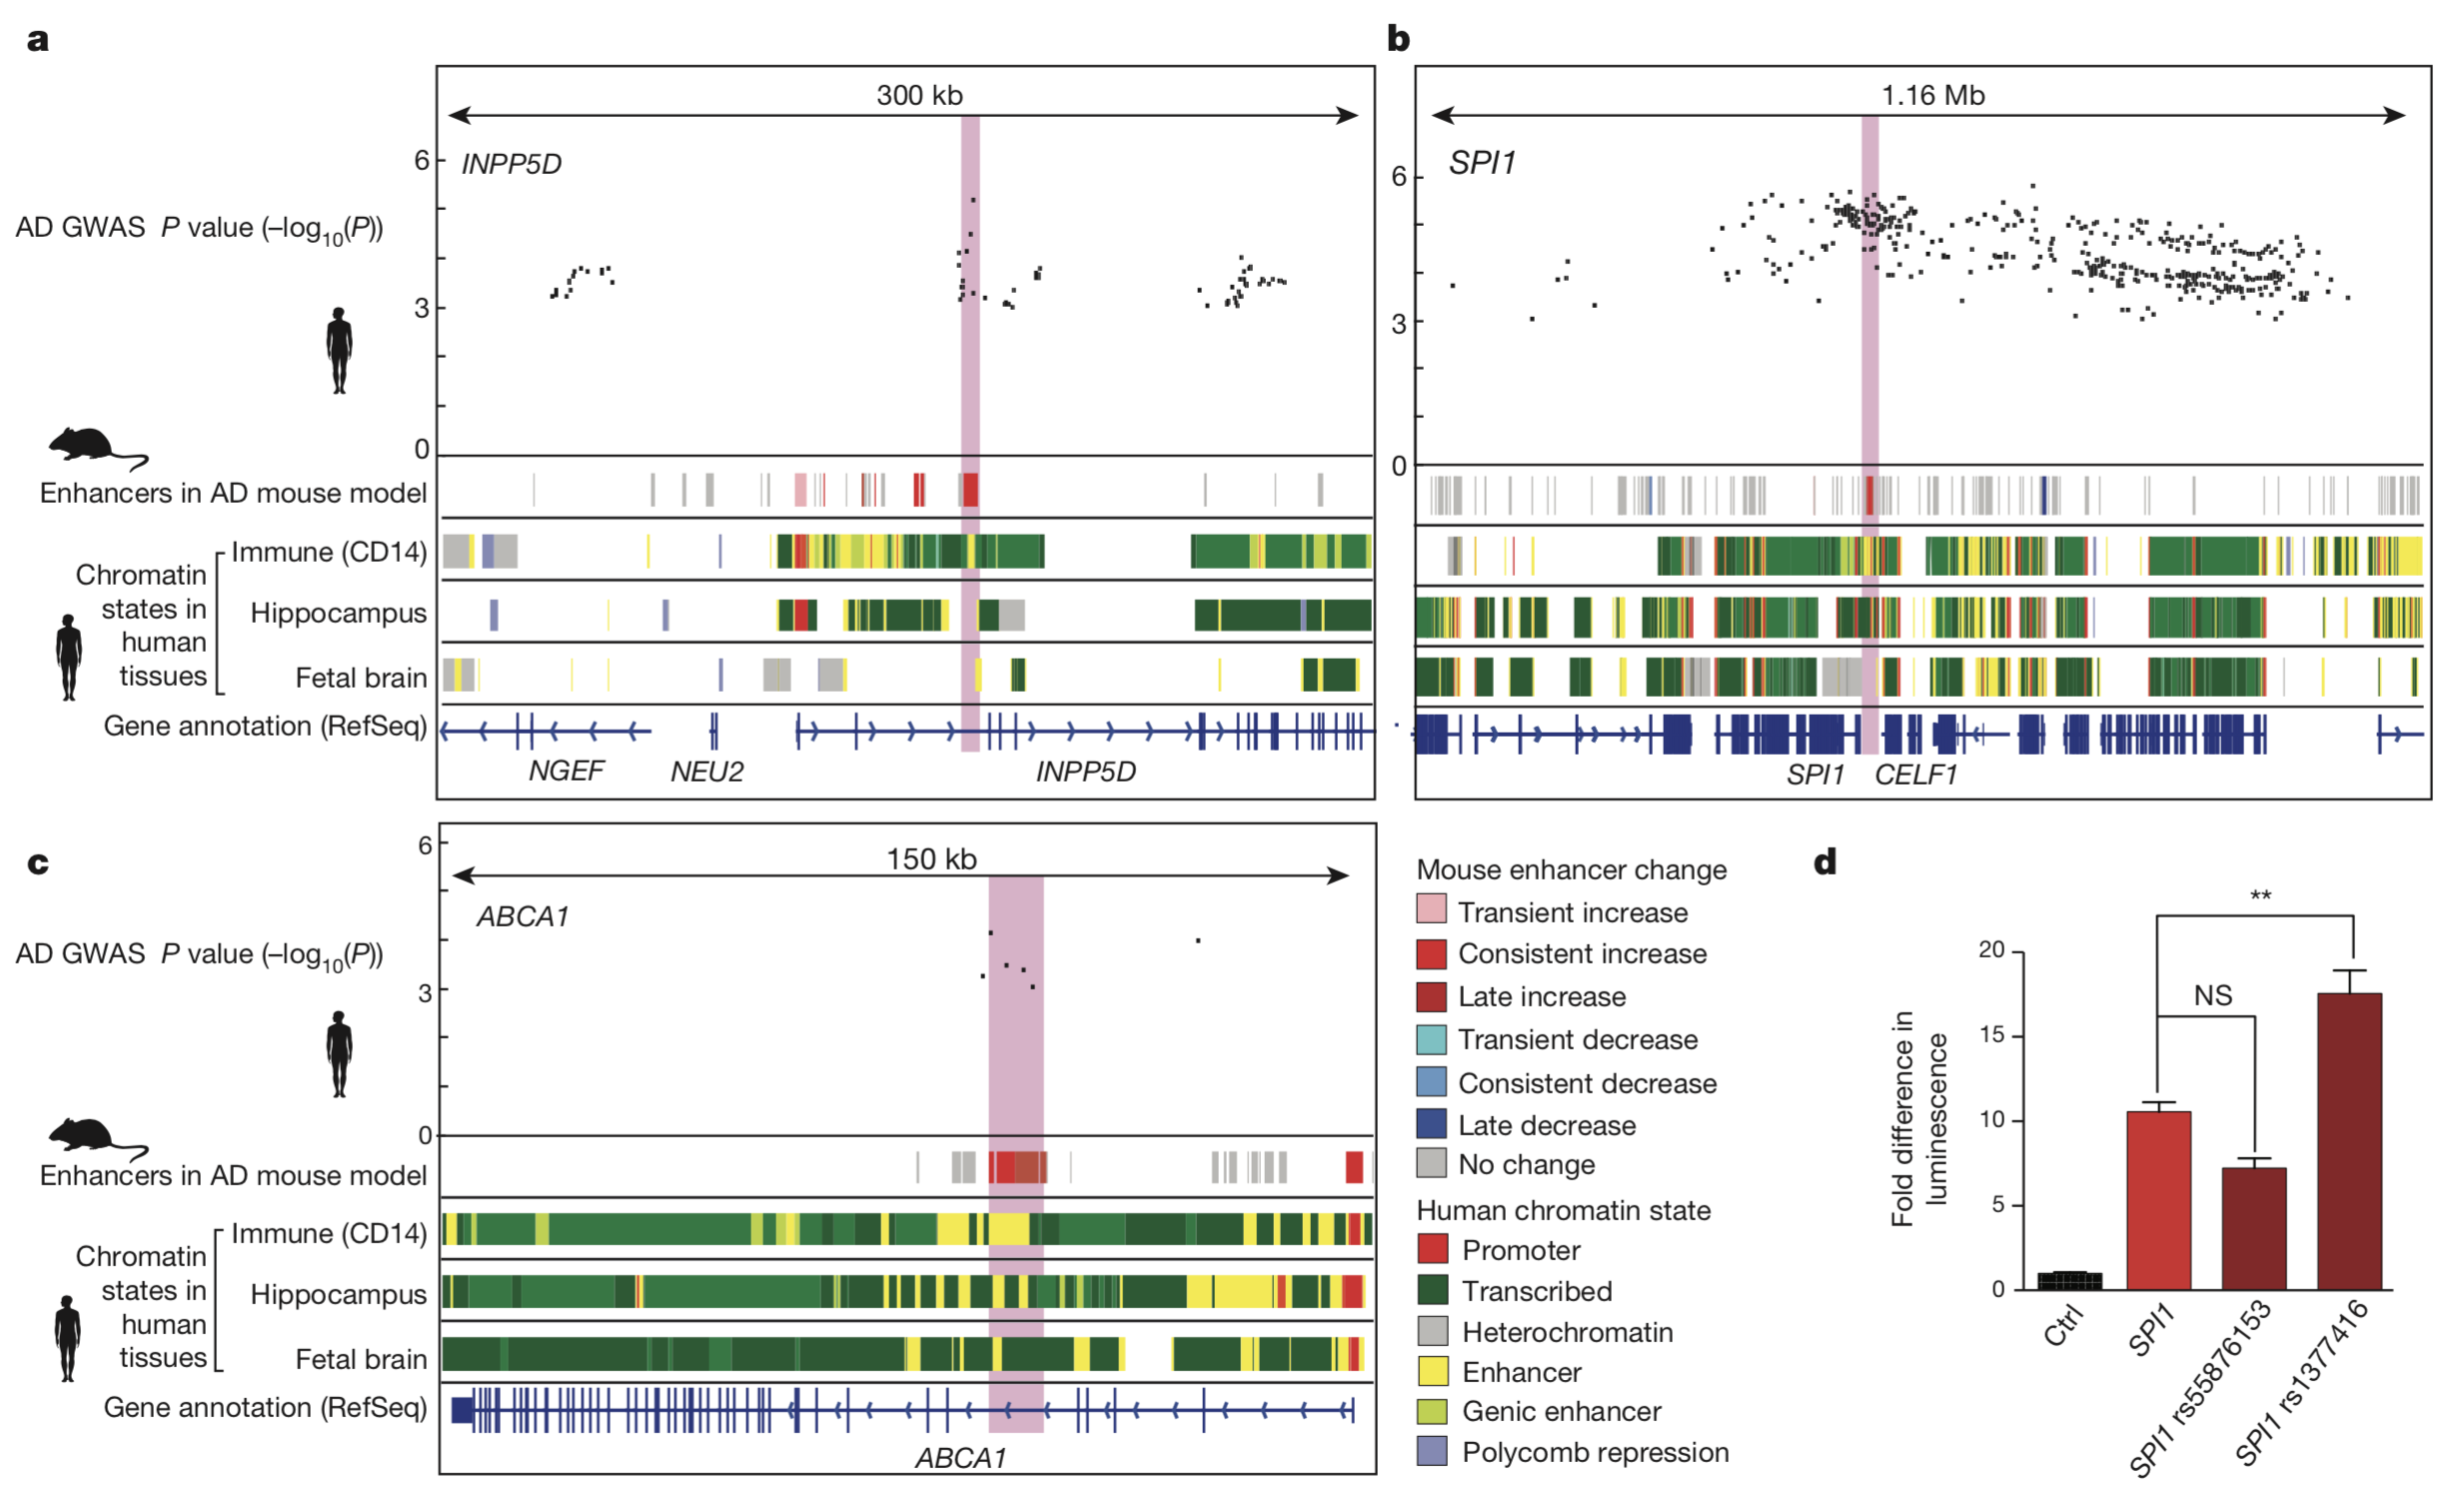
Finally, the researchers turned their focus to GWAS-determined AD-associated human genetic loci which lie in increased-level enhancer mouse orthologs as potential candidates for further experiments. In one such an experiment, the researchers demonstrate the ability for a known, AD-associated SNP located in an enhancer region upstream of the immune-function regulating transcription factor gene, SPI1, to significantly amplify enhancer activity as compared to wild type in an in vitro experiment employing mouse model brain-specific immune cells. This result provides a direct connection between AD-associated SNPs in enhancer regions and genes regulating immune function. The study concludes by laying out a model of AD in which genetically-driven immune dysregulation–as this investigation suggests is mediated by mutations in increased-level enhancer regions–combines with environmentally-attributable epigenomic changes in neuronal cells to enhance immune susceptibility to AD-associated environmental factors during aging and cognitive decline.

Opinion:

This paper was a well-written presentation of challenging concepts with which many outside the field may not be familiar. Investigating epigenomic mechanisms provides a challenge to biologists unlike transcriptomic or genetic mechanisms because much less is known about epigenomics than other, more well-studied fields. One way in which the authors make epigenomics approachable is by collecting their epigenomic data and presenting these data in parallel to transcriptomic data. High throughput transcriptomic data, with which genomicists are very familiar, are often presented as heatmaps quantifying deviation of expression from that in a control, just as they are in this paper. The researchers in this study collected epigenomic data in a similar manner to that in which transcriptomic data is collected, quantifying levels of epigenomic marks relative to levels of these marks in controls. The authors present the epigenomic data they collected in a similar manner to their transcriptomic data, in heat maps which conserve the color scale used when presenting their transcriptomic data.

I particularly appreciated the conservation of color legends the authors preserved in all of the figures of the paper. Colors established to determine upregulation, downregulation, timing, and cell types in Figure 1 were preserved in Figures 2 and 3 and made drawing meaningful conclusions from these figures easier. The figures were presented in an intuitive manner and were well marked with symbols denoting the source of data, either from human studies or from mice.

Finally, the quality of science in this paper was elegant. The researchers are very thorough in their approach and take care to demonstrate the quality of their model organism, the Ck-p25 mouse, for studies investigating AD. Additionally, I appreciated the honesty of the researchers in telling the story of both the promoter regions and the decreased-level enhancers even though these stories do not feature prominently in their overall conclusion. Telling these stories allowed me to see the process by which they narrowed down the data to eventually come to determine the important role increased-level enhancers seem to play in AD.


Figure 1. (a) The researchers display quantification the transcriptomic data they collected using a heat map. The data are segregated into two broad categories: upregulated transcription, in the three shades of red; and downregulated transcription in the three shades of blue. The lightest shades of each color represent transiently differentially expressed genes, the intermediate shades represent consistently differentially expressed genes, and the darkest shades represent late-onset differentially expressed genes (see main text for more detailed descriptions of these terms). Along the top of this figure, gene ontology categories are listed and are segregated into three broader categories by the colors on top of which they are listed: orange for immune functions, grey for intercellular interactions, and purple for neuronal functions. These orange and purple colors are used to denote immune and neuronal function/cell types throughout the paper. The gene ontology terms and functional categories are used throughout Figure 1 in the three heatmaps presented in panels a, c, d, and e. In panel a, it is apparent that genes involved in immune functions and intercellular interactions are significantly transcriptionally upregulated in CK-p25 AD-model mice relative to controls, and that genes involved in neuronal functions are generally transcriptionally downregulated in CK-p25 AD-model mice relative to controls. Cell cycle-associated genes especially, seem to be upregulated at a late stage while other immune function-associated genes are significantly transcriptionally upregulated for across all three temporal distinctions. Neuronal function-associated genes seem to be broadly transcriptionally downregulated in CK-p25 mice relative to controls, including significant enrichment at the consistent and late-onset temporal scales. Genes involved in intercellular interactions seem to be divided between upregulation and down regulation as compared to controls, but in both cases these genes were significantly differentially expressed at the late-onset timescale. (b) Panel b provides a comparison of the transcriptomic data observed in mice presented in a to those observed in a study between postmortem AD human brain samples and controls. These data present quantifications of relative differential expression of each of the groups of genes for both upregulated and downregulated genes across all timescales with accompanying significance values. These data indicate agreement between the mouse model and human AD-associated transcriptomic data, especially at the consistent and late-onset timescales for both upregulation and downregulation, demonstrating the CK-p25 mice as a biologically relevant and appropriate model for AD. (c) Panel c further demonstrates the biological relevance of the CK-p25 mouse model for AD as genes associated with immune functions were generally upregulated, genes associated with neuronal functions were generally downregulated, and as genes associated with intercellular interactions were both upregulated and downregulated between human AD patients and controls. (d, e) Panels d and e present heat maps quantifying H3K4 trimethylation (H3K4me3) in promoter chromatin state regions of the genome and H3K27 acetylation (H3K27ac) in enhancer chromatin state regions of the genome, respectively, in CK-p25 mice relative to controls. H3K4me3 and H3K27ac epigenomic marks, which decorate promoter or enhancer sequences, indicate these regulatory regions are in an active state, leading to the transcription of the genes under regulatory control. For both promoters (d) and enhancers (e), it seems that these data generally agree with those found in the transcriptomic analysis (a) as genes associated with immune functions demonstrate higher enrichment for increased level promoter H3K4me3 and enhancer H3K27ac, indicating more transcriptionally active epigenetic profiles relative to controls, while genes associated with neuronal functions demonstrate lower enrichment for increased level promoter H3K4me3 and enhancer H3K27ac, indicating more transcriptionally inactive epigenetic profiles relative to controls. (f, g) Panels f and g present heat maps quantifying enrichment for transcription factor motifs found within increasing- or decreasing-level promoter (f) and enhancer (g) regions between CK-p25 mice and controls, in which time scales are indicated at the same horizontal levels from panels d and e. Increasing-level and decreasing-level regulatory regions demonstrated enrichment for distinct groups of transcription factor motifs. Despite indicating that all transcription factor motifs were associated with both immune and neuronal functions in the figure, in the text, the authors claim that increasing-level regulatory regions were enriched for immune-regulator targeting while decreasing-level regulatory regions were enriched for neurodevelopmental-regulator targeting. (h, i) Panels h and i present heat maps quantifying transcription factor binding to changing-level regulatory regions between CK-p25 mice and controls in which time scales are indicated at the same horizontal levels from panels d and e. Increasing-level regulatory regions were enriched for binding of immune-regulating transcription factors, particularly including PU.1, a known activator of microglia, the resident immune cells of the brain and which are implicated in AD. Decreasing-level regulatory regions were enriched for binding of neuronal-regulating transcription factors.


Figure 2(a) Panel a presents enrichment for human orthologs for each of the six categories of changing-level enhancer sequences the found between CK-p25 mice and controls, with emphasis upon consistently increasing-level enhancers. Enhancer sequence enrichment is quantified on the vertical axis for 127 human tissues/cell types along the horizontal axis. Increasing-level enhancer orthologues were most enriched in immune/blood cell types while decreasing-level enhancer orthologues were most enriched in fetal brain cell types. (b) Panel b depicts the results from an experiment in which the researchers assayed the ability for human orthologs of increasing-level enhancers to drive in vitro gene expression in mouse cell line models of brain-specific immune cells (microglia) and neuroblastoma cells. Two of nine of the increasing-level enhancer orthologs drove gene expression in both the immune and neuronal model cell lines while an additional six increasing-level orthologs drove gene expression exclusively in the immune model cell line. These data demonstrate the biological relevance of the CK-p25 mouse model for AD again, and specifically indicate the functional conservation and conserved cell-type specificity for increasing-level enhancers between the mouse model and humans. (c) Panel c demonstrated differential enrichment for orthologous human AD-associated SNPs as discovered in GWAS in the mouse increasing-level enhancer sequences across the six time scales the researchers define in Figure 1. Consistently increasing-level enhancers and late-onset increasing-level enhancers demonstrated significant enrichment for AD-associated SNPs (significance indicated in text) while decreasing-level enhancers did not demonstrate strong enrichment for AD-associated SNPs, implicating genetic variation in increasing-level enhancers, rather than decreasing-level enhancers as possibly causal in genetic predisposition to AD. (d, e) Panels d and e depict the results between parallel analyses of concordance between enrichment for human AD-associated SNPs and enrichment for either consistently increasing- (d) or consistently decreasing-level (e) enhancer sequence orthologs in a diverse profile of cell types including immune, adult brain, and fetal brain cell types. Consistently increasing-level enhancers demonstrated a positive correlation with human AD-associated SNPs (R2 = 0.49), but consistently decreasing-level enhancers only showed a very weak correlation (R2 = 0.05), consistent with the results presented in panel c. Human immune cell types demonstrated higher enrichment for both human AD-associated SNPs and consistently increasing-level enhancers than any other cell types, including neuronal cells, implicating immune cell functions in AD processes involving changing level enhancers.


Figure 3. (a, b, c) Panels a, b, and c present three genetic loci associated with AD which are annotated with a number of features including (1) AD-associated SNPs (with corresponding significance indicated by their vertical positioning), (2) orthologous changing-level enhancer status as discovered in the CK-p25 mouse model relative to controls, and (3) chromatin states indicating general functional categories in three different human cell types/tissues including immune cells, the adult hippocampus, and the fetal brain. These data present potential causative SNPs found within the relevant orthologous increasing-level enhancer regions which themselves are shown to have enhancer function most strongly conserved in human immune cell types. These panels thus present genetic regions containing features consistent with the author’s narrative of genetic predisposition to AD, in which mutations found in consistently increasing-level enhancer orthologs (orthologous to enhancer regions in human immune cells) mediate immune function-specific dysregulation, eventually leading to AD-associated phenotypes as patients age and become increasingly susceptible to AD-associated environmental factors. (d) Panel d presents data from an experiment in which the researchers assayed the ability for two SNPs found in an enhancer region for the SPI1 gene, which encodes the immune function-associated regulator PU.1, to alter the function of the enhancer relative to its function in the wild-type SPI1 genetic locus (b) in a mouse cell line model of the resident immune cells of the brain. One of the SNPs, rs1377416, was shown to significantly increase enhancer activity, demonstrating dysregulation of a known immune-regulating transcription factor in a relevant model cell type, consistent with the authors’ model of AD.

References:

Genomics Page

Biology Home Page


Owen's Home Page

Email Questions or Comments: owkoucky@davidson.edu


© Copyright 2018 Department of Biology, Davidson College, Davidson, NC 28035