The Journal of Biological Chemistry Vol. 266,
No. 24, Issue of August 25, pp. 16050-16055, 1991
© 1991 by The American Society for Biochemistry
and Molecular Biology, Inc.
(Received for publication, October 29, 1990)
From the Departments of *Biology and +Medicine,
The Johns Hopkins University, Baltimore, Maryland 21218 and
the #Department of Biological Chemistry, University
of Maryland School of Medicine, Baltimore, Maryland 21201
¶To whom correspondence should be addressed.
Two similar forms of the cardiac/slow Ca2+-ATPase (SERCA2a and SERCA2b), differing in sodium dodecyl sulfate-polyacrylamide gel electrophoresis mobility, are expressed in chicken heart and brain (Kaprielian, Z., Campbell, A. M., and Fambrough, D. M. (1989) Mol. Brain Res. 6, 55-60). In the current study, cDNAs encoding each form were cloned and sequenced. Chicken SERCA2a is 94% identical to its rabbit homologue, while SERCA2b has an extended carboxyl-terminus with 38 of 49 amino acids identical to mammalian homologues. SERCA2b mRNA contains the SERCA2a encoding sequence within its 3'untranslated region. Chicken genomic DNA sequence reveals that the alternative RNA splicing used to produced SERCA2a and SERCA2b subtypes involves a splice site within an exon. Tissue culture cells expressing the avian SERCA2a, SERCA2b, and SERCA1, each targeting to the endoplasmic reticulum, were used to measure Ca2+ affinities and inhibitor effects; no differences among the three pumps were detected.
The concentration of free Ca2+ ions in the cytosol is maintained at about 0.1 µM while the extracellular level is 10,000 fold higher. Cells tightly control their cytosolic calcium levels by extruding Ca2+ across the plasma membrane as well as by sequestering calcium in internal stores (for review see Bronner and Shamoo, 1985). These internal stores of Ca2+ are filled by Ca2+-ATPases encoded by three separate genes (Brandl et al., 1986; and Burk et al., 1989).
Ca2+-ATPases (designated SERCA1, SERCA2, and SERCA3)1 are E1-E2 type ATPases with molecular mass around 110 kDa that pump Ca2+ into membrane-bound compartments. Mammalian SERCA2 is expressed as two different subtypes, SERCA2a, which predominates in cardiac and slow-twitch skeletal muscle, and SERCA2b, which is found in a variety of tissues (Lytton and MacLennan, 1988, Gunteski-Hamblin et al., 1988; Lytton et al., 1989, Eggermont et al., 1989). The two subtypes are identical except that the four carboxyl-terminal amino acids of SERCA2a are replaced by 49 or 50 different residues in SERCA2b. The significance of these two forms, generated from alternative splicing of primary transcripts from the same gene, is unknown.
If the different carboxyl-termini found in mammals have functionally significant roles, one might expect this to be evolutionarily conserved. Based on immunological data, our laboratory found that two slightly different forms of SERCA2 are expressed in the chicken heart and brain (Kaprielian et al., 1989). One purpose of this study was to identify these different forms of chicken SERCA2 at the molecular level. Specifically, are the differences in the avian Ca2+-ATPase subtypes homologous to the alternatively spliced products seen in mammals? If so, are there any functional differences between the two alternative forms of SERCA2 (e.g. inhibitor sensitivity or Ca2+ affinity)?
MATERIALS AND METHODS
Enzymes and Radioisotopes - Restriction enzymes were purchased from Pharmacia LKB Biotechnology Inc., Amersham Corp., and New England Biolabs. Radioisotopes ([32P]dATP, [32P]dCTP, and deoxyadenosine [35]5'-α-thio) triphosphate were purchased from Du Pont-New England Nuclear.
cDNA Library Construction and Screening - Total RNA was extracted from the heart and brain of one adult chicken in guanidine thiocyanate as described in Taormino and Fambrough (1990). The poly(A) RNA was converted to oligo (dT)-primed double-stranded cDNA, methylated, coupled with EcoRI linkers, ligated into lambdaZAP phage vector and packaged (Stratagene Cloning Systems). (However, based on examination of numerous clones encoding several different proteins, it has become apparent that the cDNA used to make this library had been incompletely methylated. Many clones terminate at internal EcoRI sites and some have unrelated sequences ligated adjacent to the clones of interest.) For screening the libraries, the coding region of rat stomach SERCA2a (Gunteski-Hamblin et al., 1988) was excised with PstI and isolated as described (Davis et al., 1986). The resulting probe was labeled with 32P by the method of Feinberg and Volgelstein (1983). Hybridization of probe to nitrocellulose filter lifts of the plated library was performed overnight in a solution of 120 mM Tris, pH 8, 600 mM NaCl, 4 mM EDTA, and 50% formamide at 68 ° C. Forty and 20 positive clones from the brain and heart cDNA libraries, respectively, were rescreened with the same rat probe. Five clones from each library were isolated by an in vivo excision method involving the helper phage R408 (Stratagene Cloning Systems).
cDNA Sequencing and Analysis - All but the 107 5' most nucleotides (noncoding) of SERCA2 were sequenced on both strands by the dideoxynucleotide termination method (Sanger et al., 1977) with the U. S. Biochemical Corporation Sequenase kit. Some clones were sequenced after subcloning restriction fragments. Synthetic oligonucleotide sequencing primers were made on the 391 DNA Synthesizer (Applied Biosystems) and used to sequence other clones. By the procedure in Sambrook et al. (1989), nested deletions were produced with exonuclease III to sequence one clone. The GAP program of GCG (a software package from the University of Wisconsin) was used for computer comparisons of cDNA sequence similarity across species.
RNA Blot Analyses - Total RNA was isolated from adult and embryonic heart and brain tissues by the RNAzol B method (Cinna/ Biotecx Laboratories International Inc.). 30 or 45 µg of total RNA were loaded onto a 0.6% agarose gels containing formaldehyde. Probe A in Fig. 3A was derived from the 1.3-kb EcoRI fragment of clone B132 and labeled with 32P. The remaining probes were generated by a PCR (Perkin-Elmer Cetus) procedure with primers which were designed to amplify specific regions of chicken SERCA2. The primers are as follows: probe B, 5' primer AAGAAAACAAAAGCAT (bases 3520-3535 as numbered in Fig. 2A), 3' primer GAAACAATCTGACACAA (reverse complement of bases 4001-4017); probe C, 5' primer GTAATCACTTCCTAAAC (4408-4424), 3' primer TACATAAGCTGTTATAG (reverse complement of bases and 4820-4836); and probe D, 5' primer CTGGCGTGTTATTTGATGCAC (bases 5183-5203), 3' primer GAGGGATTTACAAACAATG (reverse complement of bases 5442-5460). Reaction conditions were 10 mM Tris-HCI, pH 8.3 (at 25° C), 50 mM KCl, 1.5 mM MgCl2 0.001% gelatin, 2.5 units of Amplitaq DNA polymerase (Perkin Elmer-Cetus), with 0.07 mM non-radioactive deoxynucleotides, and 125 µCi of a 32P-labeled dATP and dCTP. 30 temperature cycles of 95, 50, and 72° C for 1 min each were performed to produce each probe. The reaction products were then passed through two Sephadex G-50 spin columns to purify the radiolabeled probes. The 5' end-labeled probe E in Fig. 3 is an oligonucleotide 30 bases long with the sequence of ATTACTCCAGTATTGCAGGTTCCAGGTAGT. This sequence is comprised of 15 nucleotides on either side of the alternative splice site, half of which are specific for the SERCA2a terminal encoding sequence.
Gene Structure - The primers used to subclone the chicken genomic DNA that included the alternative splice site were 5 ' GGAATTCATCTGGCTGGTGGAGC (an EcoRI linker plus bases 2788-2804) and 3' GGAATTCATATCACTAAAGTTAG (an EcoRI linker plus reverse complement of bases 3101-3117). 1.5 µg of chicken genomic DNA were used as template in reaction conditions outlined above but without radiolabeled nucleotides. The PCR product was digested with EcoRI and cloned into the vector pBluescript. Another pair of primers was designed to amplify the intron downstream of the SERCA2b unique sequence: 5' AAGAAAACAAAAGCAT (bases 3520-3535) and CAACCTCACATTTCTGC (reverse compliment to bases 44314447). When the latter pair of primers was used, no product was seen when genomic DNA was used as template. However, cDNA template yielded a band of the correct size. The inability to amplify this portion of the SERCA2 chicken gene is consistent with the human gene structure which has a 3kb intron in this region (Lytton and MacLennan, 1988).
Expression in Tissue Culture - Full-length cDNAs of SERCA2a and SERCA2b were constructed by ligating the appropriate fragments of clones B13, B14, and H14. Two "false-start" ATGs in the 5'-UT region were deleted by a PCR method. The 5'-oligo contained a KpnI site, a translation initiation consensus sequence (Kozak, 1989) and the first nine coding nucleotides (TGTGTGGTACCCCGACCATGGAGAACG). The other PCR primer was based on sequence down stream of the SpeI site at position 463. The PCR conditions were as described above with an extension time of 30 s. The resulting product was digested with SpeI and KpnI and cloned into pBluescript and sequenced. This was then ligated onto the 5' end of both SERCA2a and SERCA2b. SERCA2b was digested with SspI and recloned into pBluescript in order to delete the sequence containing the SERCA2a carboxyl-terminal encoding nucleotides. The modified cDNAs of SERCA2a and SERCA2b were cloned into the KpnI site of the expression vector pcDL-aSR296 (Takebe et al., 1988). Chicken SERCA1 (Karin et al., 1989) was cloned into the EcoRI site of pcDL-aSR296. COS-1 cells were transfected using DEAE dextran (Clarke et al., 1989b) with the modification of substituting 10% dimethyl sulfoxide for chloroquine.
Immunofluorescence - Transfected cells were fixed (25 mM HEPES, pH 7.4, 2.5 mM Mg acetate, 25 mM KCl, 250 mM sucrose, and 1% formaldehyde at room temperature) for 10 min and permeabilized with 0.25% Saponin. The cells were then incubated with a chicken-specific monoclonal antibody to SERCA2 (CaS-3H2, Kaprielian and Fambrough, 1987) or SERCA1 (CaF3-5C3, Karin et al., 1989) followed by a rhodamine-conjugated goat anti-mouse secondary antibody and photographed on an epifluorescence microscope.
Microsome Preparation - As in Clarke, et al. (1990), twenty 150 x 25-mm plates of transfected COS-1 cells were washed twice with 10 ml of phosphate-buffered saline, harvested in 80 ml of 5 mM EDTA in phosphate-buffered saline, and washed with 40 ml of phosphate-buffered saline. The cells were resuspended in 16 ml of 10 mM MOPS, pH 7.0, 0.5 mM MgCl2, 200 KIU/ml aprotinin, 1 mM phenylmethylsulfonyl fluoride and, after 10 min to allow for hypotonic swelling of cells, homogenized with Dounce homogenizer. The suspension was diluted with 0.5 M sucrose/6 mM 2-mercaptoethanol/40 µM CaCl2/ 300 mM KCl/20 mM MOPS, pH 7.0, and centrifuged at 10,000 x g for 20 min. The supernatant was adjusted to 600 mM KCl and centrifuged at 100,000 x g for 60 min. The pellet was resuspended with 50 mM MOPS, pH 7.0, 10% sucrose and frozen in liquid nitrogen for later use.
Calcium Uptake Assay - 5.0 ml of the reaction mixture (20 mM MOPS, pH 7.0, 60 mM KCl, 5 mM MgCl2, 5 mM sodium oxalate, 0.2 mM EDTA, 2.5 mM ATP, 0.2 mM CaCl2 (with 0.4 µCi/ml 45Ca2+) and 10 µg/ml of microsomal protein) was equilibrated at 25° C for 5 min. 1.0 ml aliquots were filtered (0.45-µm pore size; Millipore) and washed with 12 ml of 10 mM MOPS, pH 7.0, 2 mM LaCl3. A liquid scintillation counter was used to determine amounts of 45Ca2+ in each aliquot. For the cyclopiazonic acid and thapsigargin studies, the inhibitors were present during the 5-min incubation period. For the calcium concentration-dependent studies, free calcium concentration was varied as estimated from total CaCl2 and EGTA in solution (Fernandez-Belda et al., 1984). The data points in Figs. 6 and 7 represent averaged results obtained from two or three independent transfections and microsome preparations.
RESULTS
cDNA Sequence and Analysis - A cDNA probe encoding rat SERCA2a was used to screen chicken heart and brain cDNA libraries at high stringency (68° C, 50% formamide). A number of overlapping cDNA clones from each library were excised in vivo (see Materials and Methods) and sequenced to yield complete nucleotide sequences encoding chicken SERCA2a and SERCA2b. Clone B112 did not contain the complete coding sequence but it was of particular interest since it was the only clone isolated from the brain cDNA library which encoded the SERCA2a carboxyl-terminus. No poly(A)+ tails were found in any of the clones, perhaps due to the presence of an EcoRI site between the polyadenylation signal and the poly(A) tail in combination with partial methylation of the cDNA during construction of both libraries (see Materials and Methods).
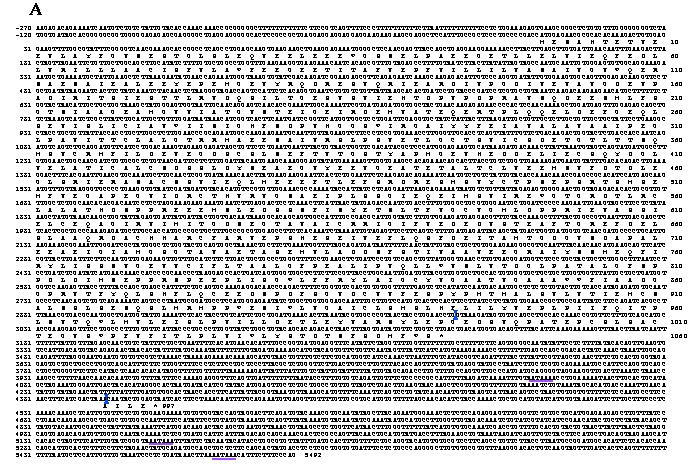
The nucleotide and deduced amino acid sequences of chicken SERCA2a are shown in Fig. 1A. The amino acid sequence is 94% identical to mammalian homologues (MacLennan et al., 1985, Lytton and MacLennan, 1988, and Gunteski-Hamblin et al., 1988, Eggermont et al., 1989). Of the variant amino acids, conservative changes account for nearly half of the substitutions.


FIG. 1. Nucleotide and deduced amino acid sequences of chicken SERCA2 cDNAs. Panel A, nucleotides are numbered on the left and amino acids on the right. Amino acids are identified by single letter abbreviations below their codons, stars denote stop codons, and consensus polyadenylation signals are underlined in purple. The alternative splice site occurs at base 2980. The SERCA2b unique sequence is located between the two pair of blue triangles and is absent from SERCA2a mRNA as a result of alternative splicing. The SERCA2a carboxyl-terminus is written below its encoding sequence with the first base of the first codon located 5' of the alternative splice site. Panel B, the diagram depicts mRNAs transcribed from SERCA2. The black boxes represent coding sequences of SERCA2 with open boxes indicating the UT portions. The blue lines indicate the relationship of the SERCA2b unique sequence to the SERCA2a mRNA.
In addition to the cDNA clones that encode SERCA2a, the avian cDNA homologue of mammalian SERCA2b was also sequenced. The nucleotide and deduced amino acid sequences of SERCA2b are presented in Fig. 1A. The 44 additional carboxyl-terminal amino acids account for the difference in apparent molecular mass between SERCA2a and SERCA2b seen by SDS-PAGE (110 versus 115 kDa). When the carboxyl-terminus of avian SERCA2b is compared to homologous mammalian sequences, 38 of 49 amino acids are identical with six out of the 11 substitutions being conservative ones. Among the various chicken cDNA clones, there are three base substitutions occurring in the coding region. These changes do not alter the primary structure of the protein and are probably caused by two different alleles being expressed by a heterozygous animal used for construction of the libraries. The changes are from C1014 to A, T1971 to C, and C2767 to A.
Previous publications of SERCA2 sequences (Lytton and MacLennan, 1988, Gunteski-Hamblin et al., 1988, Lytton et al., 1989, and Eggermont et al., 1989) had not shown the correct relationship between SERCA2a and SERCA2b mRNA. The fact that the 3'-UT region of SERCA2b message also contained the sequence which encodes the SERCA2a carboxyl-terminus was not realized. But as shown in Fig. 1, A and B, the SERCA2a terminal encoding cDNA is downstream of the SERCA2b cDNA. In order to translate SERCA2a, the primary transcript must be spliced so that all of the SERCA2b unique sequence is excised. By removing the SERCA2b unique sequence, the encoding sequence of the four terminal amino acids of SERCA2a becomes contiguous with the bulk of the coding region, thus allowing SERCA2a translation. Therefore, primary transcripts of the SERCA2 gene contain the encoding sequences for both SERCA2a and SERCA2b. After processing the RNA, the 3'-UT region of SERCA2b mRNA still contains the SERCA2a-terminal encoding sequence while SERCA2a mRNA has had its SERCA2b unique portion excised.
mRNA Processing - To delineate exact intron/exon boundaries surrounding the chicken alternative splice site within the gene, PCR was employed to amplify a portion of the gene. The deduced gene structure and RNA splicing pattern are shown in Fig. 2. Primers were designed to amplify both the alternative splice site and the intron upstream of the SERCA2b unique sequence. The resulting PCR product was cloned and sequenced. Between nucleotides G2859 and A2860 is a 119-base pair intron3 which begins with GT and ends in AG. An intron occurs at the homologous position in the human SERCA2 gene (Lytton and MacLennan, 1988). There is no intron at the alternative donor splice site used to generate SERCA2a mRNA.

FIG. 2. Alternative splicing of SERCA2. The diagram shows the primary transcript with exons as boxes and introns as thick lines. The black boxes indicate coding sequences 5' of the alternative splice site. The stippled boxes are the coding regions for the two different carboxyl-termini. Open boxes are '3'-UT regions. The splicing pattern (thin lines) on top results in SERCA2b encoding mRNA and the bottom pattern results in SERCA2a encoding mRNA. The small arrows mark the location and direction of the PCR primers used to identify the gene structure.
A series of probes to different regions of the 3'-UT regions of SERCA2 were hybridized to RNA blots to determine which of three potential polyadenylation signals are used in mRNA processing. Probe A was the EcoRI fragment depicted in the diagram in Fig. 3. The resulting bands (Fig. 3, blot A) show the relative amounts of heart and brain mRNA loaded in blots A through E. Probe B, which hybridizes to a SERCA2b specific portion of the sequence, does not hybridize to the heart RNA but does detect high levels of SERCA2b mRNA isolated from brain tissue. Embryonic brain also contains mRNAs that include the sequence unique to SERCA2a; only SERCA2a mRNA was detected in embryonic heart (data not shown). The first consensus sequence for polyadenylation occurs at nucleotide 4048, within the 3'-UT region unique to SERCA2b. Little if any SERCA2b mRNA uses the consensus sequence at 4048 since the band detected with probe B has an apparent size 1 kb greater than that predicted for messages terminating at 4048. In RNA blots from both heart and brain, bands are evident when probe C was used but not probe D. These data show that for both SERCA2a and SERCA2b mRNAs, the AATAAA at 5158 is used as the predominant polyadenylation signal rather than the consensus sequence at position 5473. It is interesting to note that the rarely used polyadenylation signal sequence at 5473 is not present in homologous mammalian cDNAs. Heart transcripts occasionally use the consensus sequence at 5473 (or at some position further downstream) since one cardiac cDNA clone (H14) was found to contain the sequence downstream of the predominantly used polyadenylation signal at base 5158. (A faint signal in the heart RNA lane was detected when probe D was used but was too faint to appear in the photograph.) There is no evidence that brain messages ever use the polyadenylation signal at nucleotide 5473. Probe E, an oligonucleotide which spans the alternative splice site and is specific for SERCA2a mature mRNA, hybridizes to RNA of similar size in both brain and heart lanes. This verifies that brain does express SERCA2a but at a much lower level than SERCA2b. The brain SERCA2a mRNA was not detected in panels A or C probably because of the low expression level and smeared signal. In summary, both brain and heart transcribe messages which predominantly use the polyadenylation signal at nucleotide 5158, though heart infrequently uses the polyadenylation signal at nucleotide 5473. SERCA2a mRNA was detectable in both brain and cardiac lanes while SERCA2b message was seen in brain RNA only.
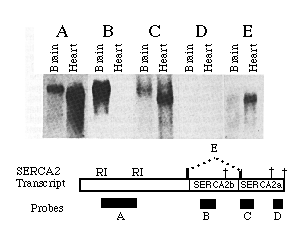
FIG. 3. SERCA2 RNA processing in heart and brain. This autoradiograph is an RNA blot probed with 32P-labled probes. One 0.6% agarose gel was loaded with replicates of 45 µg of adult brain and 30 µg of adult heart RNA, as indicated. The approximate sizes of the probes are 1.2 kb (A), 500 (B), 400 (C), 250 (D), and 30 (E) nucleotides. The molecular size markers are 4.6 and 1.8 kb. The location of each probe is indicated in the figure below with the three potential polyadenylation signals indicated by crosses.
Expression and Analysis of cDNA Clones in Tissue Culture - In order to examine functional differences among Ca2+ pumps, cDNAs encoding each SERCA2 subtype as well a chicken SERCA1 were expressed in tissue culture (see Material and Methods). Full-length constructs encoding either SERCA2a, SERCA2b, or SERCA1 were transiently expressed in COS-1 cells. The transfected cells were fixed, permeabilized, and labeled with a chicken specific anti-SERCA2 or anti-SERCA1 monoclonal antibody and rhodamine-conjugated secondary antibody. High levels of expression were obtained for all three avian Ca2+-ATPases. An immunofluorescent staining pattern indicative of the endoplasmic reticulum was observed. This is best seen at the thin edges of cells as shown in Fig. 4, A- C. These results show that SERCA1 and the SERCA2 subtypes are capable of targeting to the appropriate organelle when transfected into non-muscle tissue cultured cells. Microsomes made from similarly transfected cells were analyzed by SDS-PAGE and immunoblots. Using protein blots from 6% polyacrylamide gel electrophoresis and probing with avian-specific monoclonal antibodies, it was possible to demonstrate clearly the expressed avian Ca2+-ATPases (Fig. 4D).
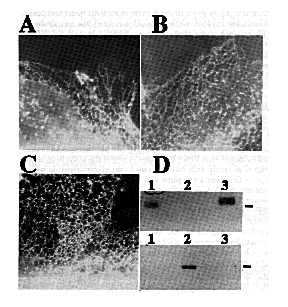
FIG. 4. Expression of chicken SERCA2a and SERCA2b cDNAs. Immunofluorescence micrographs of the thin, extreme margins of COS-1 cells transfected with SERCA2a (A), SERCA2b (B), SERCA1 (C) and labeled with a monoclonal antibody specific for chicken SERCA2 (panels A and B) or avian SERCA1 (panel C) followed by a rhodamine-labeled goat anti-mouse IgG. Panel D shows autoradiographic results of microsomes of transfected COS-1 cells analyzed by SDS-PAGE, blotted onto nitrocellulose, probed with either SERCA2- (top) or SERCA1- (bottom) specific antibodies and incubated with 125I-labeled secondary antibodies. The molecular mass marker is 106 kDa and the lanes are as follows: lane 1, SERCA2a: lane 2, SERCA1; and lane 3, SERCA2b.
To ensure that the ER localization was not merely due to accumulation of misfolded protein, microsomes of cells transfected with SERCA1, SERCA2a, or SERCA2b were assayed for their ability to sequester 45Ca2+. Fig. 5 shows that all three pumps are functional. The apparent lower activity of SERCA2a is due to lower yields of SERCA2a protein/milligram of total microsomal protein (see Fig. 4D). Equal amounts of total microsomal protein were analyzed by immunoblots to quantify relative amounts of SERCA2a and SERCA2b. There is 1.7-fold less SERCA2a than SERCA2b in the respective microsomes (data not shown). Therefore, with a factor of 1.7 to correct for the lower expression of SERCA2a, all three pumps sequester about 1100 nmol of Ca2+/mg protein/h. This is an order of magnitude greater than the rate of Ca2+ sequestration by microsomes from nontransfected COS-1 cells or cells transfected with the SERCA2a cDNA cloned into the expression vector in the reverse orientation.
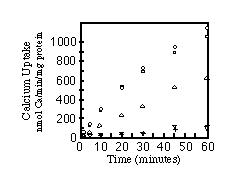
FIG. 5. Time course of calcium uptake by
microsomes. Calcium uptake assays were carried out as described
under "Materials and Methods." The curves are labeled
as follows: , SERCA2a;
, SERCA2b;
O, SERCA1; +, reverse orientation of SERCA2a in the expression
vector;
, untransfected cells.
There are two toxins reported to be SR/ER Ca2+ pump inhibitors. Both thapsigargin (TG, Thastrup et al., 1990) and cyclopiazonic acid (CPA, Seidler et al., 1989) are believed to act upon SERCA-type ATPases but not the plasma membrane calcium pumps. When calcium uptake was measured for SERCA2a, SERCA2b, and SERCA1 over a range of inhibitor concentrations, no significant differences were detected in the sensitivity of the three isoforms to the inhibitors (Fig. 6).
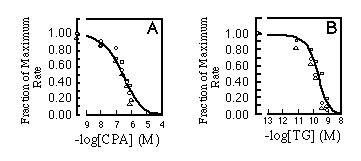
FIG. 6. Initial rates of calcium uptake.
The same reaction conditions were used as in Fig. 5 in the
presence of A, cyclopiazonic acid (CPA), or B. thapsigargin (TG).
The results are standardized as fraction of maximal rate and plotted
against concentration of inhibitory reagent added to the reaction
mixture. The curves are labeled as follows: , SERCA2a;
,
SERCA2b; O. SERCA1. Experimental points were fitted with the Hill
equation, assuming 2.19 x 10⁻⁷ M for the apparent IC50
of CPA (A) or 1.49 x 10 -10 M for the apparent IC50
of TG (B).
Finally, the apparent Ca2+ affinity for each isoform was determined. Equal amounts of microsomes were incubated with varying free Ca2+ concentrations. There was no appreciable difference in the Ca2+ activation patterns of the Ca2+-ATPases as shown in Fig. 7.
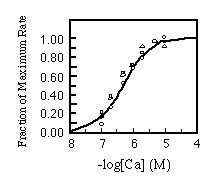
FIG. 7. Calcium concentration dependence
of initial rates of calcium uptake. Reaction conditions are
the same as used in Fig. 6 except the concentration of free calcium
was varied as described under "Materials and Methods."
The results are standardized as fraction of maximal rate and plotted
against free calcium concentration. The curves are labeled as
follows: , SERCA2a;
, SERCA2b;
O, SERCA1. Experimental points were fitted with the Hill equation
assuming 4.17 X 10⁻⁷ M for the Ca2+ concentration
yielding half-maximal activation.
DISCUSSION
Previous work has shown that two subtypes of SERCA2 with different Mr are expressed in the chicken (Kaprielian et al., 1989). This paper demonstrates that the difference is due to alternative splicing at an intraexonic donor site in the primary transcript. SERCA2a can only be expressed when a splice site donor, which occurs within the exon coding for the carboxyl-terminus of SERCA2b, is used for RNA processing. Only SERCA2a was detected in heart, while both forms of SERCA2 were expressed in brain with SERCA2b being the predominant form. This means that the internal RNA splice site donor is used much less often in brain and that the carboxyl-terminal coding sequence of SERCA2a usually appears within the 3'-UT region of SERCA2b mRNA. A similar though more complex, splicing pattern of RNA has recently been reported for mammals (Plessers et al., 1991). Unlike mammalian SERCA2 mRNA expression, there are only two forms of avian SERCA2 mRNA. The only detected SERCA2b mRNA always contained within its 3'-UT region the SERCA2a terminal encoding nucleotides. Therefore, alternative splicing via an internal donor site appears to be the mechanism to produce alternative carboxyl-termini in avian as well as mammalian SERCA2.
When SERCA2a and SERCA2b were expressed in COS-1 cells, the Ca2+-ATPases were targeted to the endoplasmic reticulum as evident by the immunofluorescent staining pattern (Fig. 4, A- C). This localization is not due to accumulation of misfolded protein since similarly transfected cells synthesized functional enzymes. In the photomicrographs, there is some punctate staining in addition to the reticular network. This could be due to incomplete fixation and vesicularization of the ER and/or capping of the Ca2+-ATPases within the ER. The antibody's epitope is glutaraldehyde and methanol sensitive so other fixation protocols were unsuccessful. The possibility of lateral mobility within the ER of SERCA2 proteins is under investigation.
We have compared the expression and activities of the three chicken isoforms in a number of ways. When analyzed by immunoblots (Fig. 4D), the bands in the SERCA2 lanes appear as broad bands. These data, in addition to some preliminary data, suggest that the calcium pump might be a glycoprotein. Functionally, the three Ca2+-ATPases are very similar in their sensitivity to Ca2+ as an activator and to CPA and TG as inhibitors. Since SERCA2a and SERCA2b differ only at their carboxyl-termini, it is not surprising that the ATPases are indistinguishable in their apparent Ca2+ affinities and inhibitor sensitivities. Although there is a 15% amino acid sequence difference between SERCA1 and SERCA2, the similar effects of TG and CPA suggest that neither inhibitor interacts with isoform-specific residues. By comparing primary sequences and pharmacological sensitivities of SERCA-type pumps from a variety of species, it may be possible to predict which regions interact with TG and CPA.
In order to understand Ca2+-ATPases more fully, it is helpful to compare primary sequences across a wide range of species. Chicken SERCA2a is 94% identical to its mammalian homolog while the carboxyl-terminus of SERCA2b is also highly conserved. A series of mutagenesis studies has furthered our understanding of the structure/function relationship (e.g. Clarke et al., 1989a, 1989b; Maruyama et al., 1989; Vilsen et al..; 1989, Andersen et al., 1989; Clarke, et al., 1990). Of the residues shown by other laboratories to be required for the function of the Ca2+-ATPase, all are completely conserved in chicken SERCA2. There is no evidence which shows that the carboxyl-terminus of a calcium pump is vital for function and yet diverse species have conserved, through millions of years, alternative SERCA2a and SERCA2b termini. It remains to be determined why there is a selective advantage for birds and mammals to retain multiple isoforms of the Ca2+-ATPase.
Acknowledgments - We would like to thank Dr. Gary Shull for the rat cDNA SERCA2 probe, Marianne Dieckmann (Stanford University) and Atsushi Miyajima (DNAX, Palo Alto) for kindly supplying COS-1 cells and the pcDL-SRa296 expression vector, Delores Somerville, Drs. Joseph Taormino and Anita Zot for advice and suggestions throughout this work, and Dr. Jonathan Lytton for critical and helpful discussion.
* This work was supported by National Institutes of Health Grants HL-02379 (to P. D. K.), GM-07231 (to A. M. C., predoctoral training), HL-27867, and NS-23241 (to D. M. F.). The costs of publication of this article were defrayed in part by the payment of page charges. This article must therefore be hereby marked "advertisement" in accordance with 18 U.S.C. Section 1734 solely to indicate this fact.
The nucleotide sequence(s) reported in this paper has been submitted to the GenBankTM/EMBL Data Bank with accession number(s) M66385.
Footnotes
¥ Recipient of a Clinician Scientist Career
Development Award from The Johns Hopkins University School of
Medicine.
1 The nomenclature used here was adopted from
Burk et al., (1989).
2 The abbreviations used are: PCR, polymerase
chain reaction; kb, kilobase; SDS-PAGE, sodium dodecyl sulfate
polyacrylamide gel electrophoresis ; MOPS, 4-morpholinepropanesulfonic
acid; 3'-UT and 5'UT, 3'- and 5'untranslated; HEPES, 4-(2-hydroxyethyl)-1-piperazineethanesulfonic
acid; [ethylenebis(oxyethylenenitrilo)]tetraacetic acid; TG, thapsigargin;
CPA, cyclopiazonic acid; ER, endoplasmic reticulum; SR sarcoplasmic
reticulum; Clones beginning with the letter "B" are
from the brain cDNA library while those with an "H"
are derived from the heart library.
3 The intron sequence is in lower case letters
and exon boundaries are in upper case letters. The sequence is:
GCCGgtaagtgcttctgtcttacatccatccctgagctcagaggtggagcagaaaaccttgtgtggagcataaggcaagggacggag
gtgtagcaaagctgtaatgcttggctgttctttcagATTA .
REFERENCES
Andersen, J. P., Vilsen, B., Leberer, E. and MacLennan, D.
H. (1989) J. Biol. Chem. 264, 21018-21023
Brandl, C. J., Green, N. M., Korczak, B., and MacLennan, D. H.
(1986) Cell 44, 597-607
Bronner, F. and Shamoo, A. E. Editors. (1985) Curr. Top. Membr.
Trans. 25, 1-276
Burk, S. E., Lytton J., MacLennan, D. H., and Shull, G. E. (1989)
J. Biol. Chem. 264, 18561-18568
Clarke D. M., Loo, T. W., Inesi, G., and MacLennan, D. H. (1989a)
Nature 339, 476-478
Clarke, D. M., Maruyama, K. Loo, T. W., Leberer, E., Inesi, G.,
and MacLennan D. H. (1989b) J. Biol. Chem. 264,11246-11251
Clarke, D. M., Loo, T. W., and MacLennan, D. H. (1990) J Biol.
Chem. 266, 14088-14092
Davis, L. G., Dibner M. D., and Battey, J. F. (1986) Basic
Methods in Molecular Biology pp 123-125, Elsevier Science
Publishing Company, New York
Eggermont, J. A., Wuytack F., De Jaegere, S., Nelles, L., and
Casteels, R. (1989) Biochem. J. 260, 157-761
Feinberg, A. P., and Volgelstein, B. (1983) Anal. Biochem.
132, 6-13
Fernandez-Belda, F., Kurzmack, M., and Inesi, G. (1984) J.
Biol. Chem. 259, 9687-9698
Gunteski-Hamblin A.-M., Greeb, J., and Shull, G. E., (1988) J.
Biol. Chem. 263, 15032-1504O
Kaprielian Z. and Fambrough, D. M. (1987) Dev. Biol.
124, 490-503
Kaprielian Z. Campbell, A. M., and Fambrough, D. M. (1989) Mol.
Brain Res. 6, 55-60
Karin, N. J., Kaprielian, Z., and Fambrough, D. M. (1989) Mol.
Cell. Biol. 9, 1978-1986
Kozak, M. (1989) J. Cell Biol. 108, 229-241
Lytton, J., and MacLennan, D. H. (1988) J Biol. Chem. 263,15024-15031
Lytton, J., Zarain-Herzberg, A., Periasamy, M., and MacLennan,
D. H. (1989) J. Biol. Chem. 264, 7059-7065
MacLennan, D. H., Brandl, C. J., Korczak, B., and Green, N. M.
(1985) Nature 316, 696-700
Maruyama, K, Clarke, D. M., Fuji, J., Inesi, G., Loo, TW., and
MacLennan D. H. (1989) J. Biol. Chem 264,13038-13042
Plessers, L., Eggermont, J. A., Wuytack, F., and Casteels, R.
(1991) J. Neurosci. 11, 650-656
Sambrook, J., Fritsch, E. F., and Maniatis, T. (1989) Molecular
Cloning: a Laboratory Manual, pp 5.84-5.85, Cold Spring Harbor
Laboratory Press, Cold Spring Harbor, NY
Sanger, F., Nicklen, S., and Coulson, A. R. (1977) Proc.
Natl. Acad. Sci. U. S. A. 74, 5463-5467
Seidler, N. W., Jona, 1., Vegh, M., and Martonosi, A. (1989) J.
Biol. Chem. 264, 17816-17823
Takebe, Y., Seiki, M., Fujisawa, J.- I., Hoy, P., Yokota, K.,
Arai, K.- I., Yoshida, M., and Arai, N. (1988) Mol. Cell Biol.
8, 466-472
Taormino, J. P., and Fambrough, D. M. ,(1990) J. Biol.
Chem. 265, 4116-4123
Thastrup, O., Cullen, P. J., Drobak, B. K., Hanley M. R., and
Dawson, A. P. (1990) Proc. Natl. Acad. Sci. U. S. A. 87,
2466-2470
Vilsen, B., Andersen, J. P., Clarke, D. M., and MacLennan, D.
H. (1989) J. Biol. Chem. 264, 21024-21030