Working with microarray data requires practice. As a teacher, you might want to provide your students with tiff files that are reliable and predictable. You might even want to test your students's ability to work with MAGIC Tool (or other software) and know they can produce reliable data. Therefore, we have produced a very simple way to let you generate synthetic tiff files.
The Spot Synthesizer is not intended to produce data. The purpose of the Spot synthesizer is enable teachers to help students improve their ability to work with real data efficiently. You can generate a pair of tiff files in less than a minute. You can have the spots uniformly smooth, or the spots can have some noise in the pixel data. You can even choose from 6 patterns of spots.
Click Here to Run Spot Synthesizer
The purpose of the Spot Synthesizer is to allow teachers to generate tiff files and gene lists for testing or practice purposes. You can submit a list of genes with red and green intensities for each channel. The web application will produce two tiff files that students can use to measure a predictable ratio. You can use this to test their competence and/or use as a training set with expected ratios.
Input
The application expects a space or tab separated text file. If you use Excel to generate the values, just save the file as a text file. The name of the file should be filename.txt (no spaces). Download this example in Excel which you will have to save as a tab-delimited text file, or download a Spot Synthesizer-ready file. The file should look something like this:
Red Signal Intensity |
Green
Signal Intensity |
Gene Name |
Patterns (Optional) |
20000 |
50000 |
Actin |
1 |
20000 |
10000 |
Tubulin_a |
2 |
20000 |
10000 |
Tubulin_b |
3 |
10000 |
20000 |
calcium_pump |
4 |
50000 |
30000 |
sodium_pump |
5 |
40000 |
40000 |
beta |
6 |
1000 |
5000 |
gamma |
1 |
45000 |
4500 |
delta |
2 |
10000 |
10000 |
epsilon |
3 |
65000 |
32000 |
theta |
4 |
2000 |
1000 |
brovo |
5 |
100 |
200 |
blank |
6 |
33000 |
15000 |
last |
1 |
- The maximum value for a spot is 65535. If you put
in larger values, the result will be a smaller value due to numerical
wrap around.
- To prevent any input errors, please
include the headings as shown above.
- Also, gene names are read as strings, and therefore names
cannot contain spaces.
- There is no limit to the number of entries (rows).
- Spot synthesizer will finish the last row with blank spots
to the next multiple of 5; this is true for the tiff files and the gene
list.
- You will notice that some values will not create visible pixels because the intensities are too low, but when you use MAGIC Tool or other software, you will be able to detect these low values by increasing the contrast. You may want to experiment with values to get a feel for what can be see by the human eye.
Output
The application will output three files that are save temporarily on the server:
- filenameRed.tif
- filenameGreen.tif
- filenameGene.txt
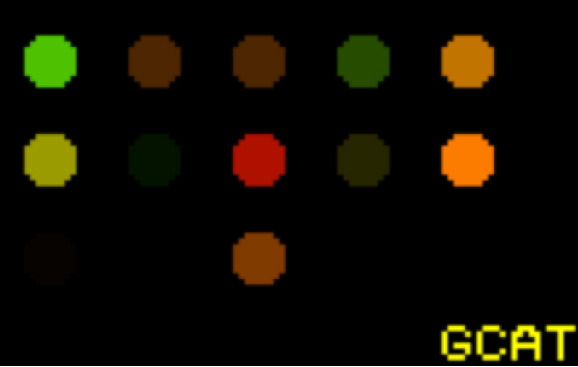
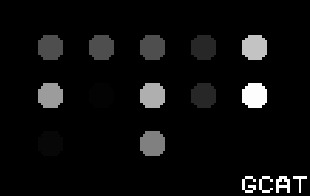
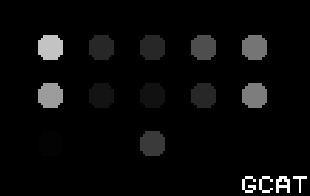
where filenameRed.tif and filenameGreen.tif are tif files containing spots with the intensities entered in the input file. The spots are arranged in rows of 5 spots each. The first spots is at the upper left of the image and the spots are arranged left to right. For example, the input file from the table above would generate the following images:
Merged Jpeg File Showing Colors |
|
Red Tiff
File |
Green Tiff File |
 |
 |
-
Depending on what type of computer you are using,
you may be able to simply click and drag them to your desktop.
Alternatively, you can right click on the image and save the image to
the appropriate place on your hard drive.
- The Gene list will be displayed below the images you can “cut and
paste” them to a file.
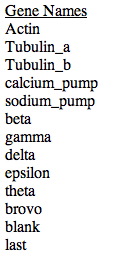
You can use these three files directly in MAGIC Tool for data analysis training or testing.
Click Here to Run Spot Synthesizer
Patterns
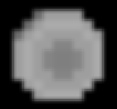
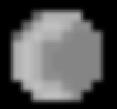
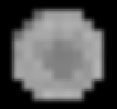
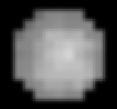
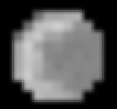
The spot synthesizer can produce 6 different patterns and you can choose any combination of patterns your output files will contain. The default setting is no pattern but if you choose pattern and forget to enter the column assigning which pattern, pattern 1 will be used as a default.
Spot 1 (regular doughnut) |
Spot 3 (center-weighted) |
Spot 5 (crescent shaped) |
 |
 |
 |
Spot 2 (doughnut with noise) |
Spot 4 (noisy center-weighted) |
Spot 6 (noisy crescent) |
 |
 |
 |
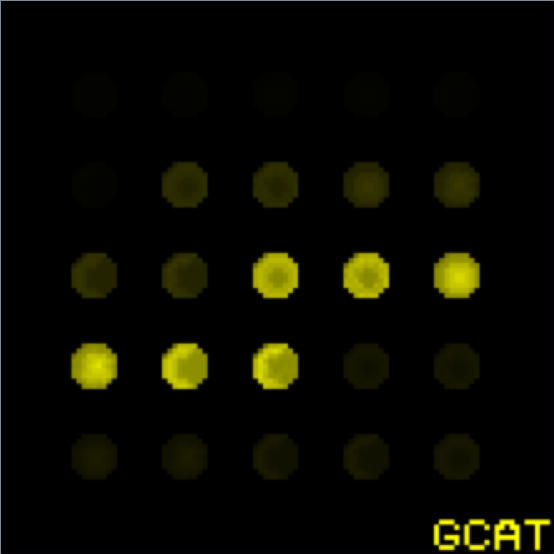
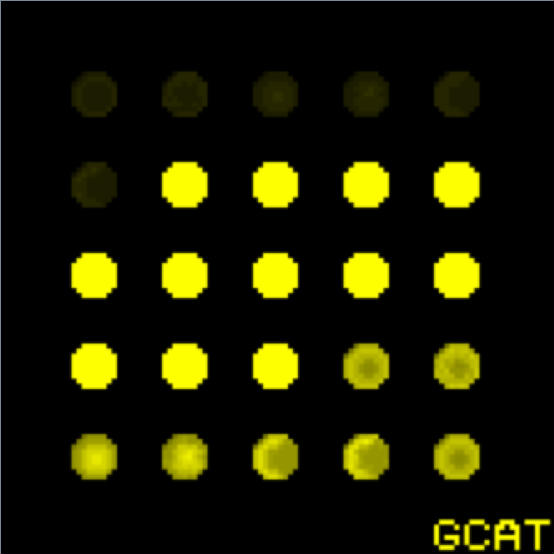
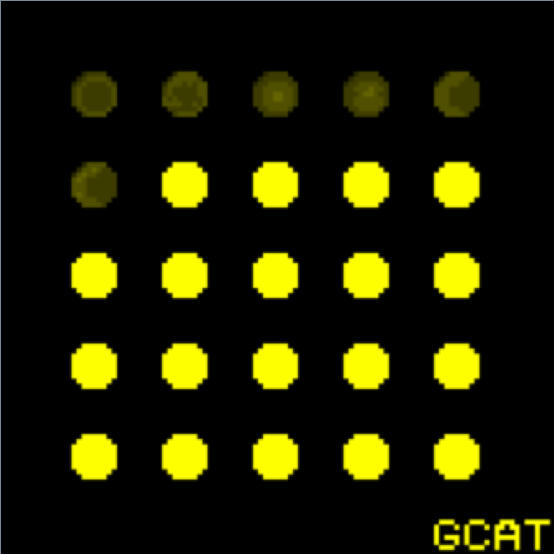
One aspect you will learn about synthesizing spots is that you cannot produce a lot of variation with high signal intensities. By definition, if you want the average intensity to be near 65,565 (the absolute maximum), then every pixel needs to be that value and thus there will not be any pattern or variation. In the images below, a single pair of tiff files were viewed at 3 different contrast levels in MAGIC Tool. As you can see, the patterns are visible at different contrasts.
Low Contrast Viewing |
Medium Contrast Viewing |
High Contrast Viewing |
 |
 |
 |
You will notice that some values will not create visible pixels because the intensities are too low, but when you use MAGIC Tool or other software, you will be able to detect these low values by increasing the contrast. You can see the Excel or tab-delimited text file used to generate the patterns.
Click Here to Run Spot Synthesizer
