Visualizing RNA movement in real time in living cells
Researchers have been forced for many years to interpret
cellular data based on fixed cells. Often the progression of particles
in the cell had to be synthesized using multiple cells fixed at different
times in hopes that the cells would sketch a pattern of particle motility.
Recently, a novel method has been developed to visualize
RNA in living cells (Bertrand and others 1998). Yeast cells
are cotransformed using two plasmids, a lacZ reporter mRNA and a GFP-MS2
fusion protein. The reporter mRNA usually contains six MS2 binding
sites, each with a 19 nucleotide stem-loop, inserted directly after the
lacZ encoding sequence termination. The multiple stem-loop localization
determinants in the insertion allow for multiple green fluorescent protein
(GFP) binding sites, thus increasing the fluorescence of the cell (Chartrand
and others 1999). The other plasmid contained a GFP sequence fused
to coding sequences for MS2, a single-stranded RNA bacteriophage capsid
protein (Figure 1A). The mRNA reporters are expressed under the influence
of GAL promoters, a galactose-inducible promoter, while the fusion proteins
are controlled by the constitutive GPD promoter.
Figure 1. A (top) Schematic of the MS2-GFP Chimeric Protein. The
protein is controlled by GPD promoter which is followed by a nuclear localization
signal (NLS) and HA tag at the N terminus to insure only target bound GFP
protein will by in the cytoplasm. Following the HA tag is the MS2-GFP
protein and the protein terminator. (bottom) Schematic of mRNA reporters
controlled by GAL promoters. The reporters contain a 5' intron followed
by the lacZ encoding sequence and six MS2 binding sites immediately after
the translation termination codon. The 3' untranslated region of
the ASH1 gene, which contains the localization signal in yeast, follows
the MS2 binding sites.
B. Live cells expressing the lacZ-MS2-ASH1 reporter mRNA and
GFP-MS2 fusion protein.
(See Bertrand et al., Molecular Cell 2:437-445 (1998))
The GFP-lac Z-MS2 reporter mRNA produces a bright fluorescent
particle, RNA, which can be localized within the cell (Chartrand, Meng,
Singer, Long 1999). The particles are bright enough to follow in
living cells using real time digital imaging and video microscopy, allowing
for analysis of motion, speed, and location of particles (Beach DL, Salmon
ED, Bloom K 1999; Bertrand and others 1998). High levels of background
fluorescence is inhibited by the addition of a nuclear localization signal
and HA tag, which allow only GFP-MS2 chimera to reside in the cytoplasm.
Now excluding any unbound GFP, the quantity of reporter mRNA at a particular
location can be determined by monitoring the accumulation of fluorescent
protein synthesized at the target area (Long and others 1997). Using
a video camera connected to a VCR, moving particles within live cells mounted
between two cover slips can be identified by their fluorescence and followed
for up to four minutes. Live-cell-time-lapse images made with a digital
camera can reveal movements dependent on cellular cycles within the same
cell (Bertrand and others 1998). The cells can be constructed using
a digital camera and 3D Reconstruction software which allows multiple point
views meshed together to form a congruent image (Beach DL, Salmon ED, Bloom
K 1999).
Figure 2. Analysis of particle movement. Bright field microscopy
and epifluorescence were used to observe wild-type yeast expressing both
GFP-protein and ASH1 reporter. Particle movement was observed using
a video camera linked to a VCR. (Time progression is represented
by progression from dark to bright colors.) (See Bertrand et al.,
Molecular Cell 2:437-445 (1998))
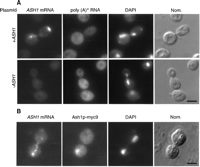
To ensure correct attribution of bright particles to the GFP-MS2/reporter
mRNA complex, fluorescent in situ hybridization (FISH) can be performed
using probes for lacZ or MS2. As detection of RNA is more sensitive
using FISH, fluorescent particles corresponding to one another in both
procedures indicates a complexed GFP-MS2/reporter mRNA (Bertrand and others
1998). RNA processing and transport is too fast for FISH to detect
subtleties in position and localization, therefore FISH is better equipped
to confirm results rather than detect them.

Figure 3. Localization of ASH1 mRNA and Ash1p to daughter cells of budding
yeast using FISH.
(See Long et al., Science 277:383-386 (1997))
Although single RNA molecules cannot be visualized using GFP, investigation of any RNA-protein complex, such as RNA processing, nuclear export, or intracellular targeting can be performed via in vivo localization. The method is applicable not only to yeast cells as presented but also to higher eukaryotic cells (Bertrand and others 1998).
To learn more about visualizing RNA movement in living cells check out
these sites:
http://www.mcw.edu/microbiology/rml.html
http://singerlab.aecom.yu.edu
http://genome-www.stanford.edu/Saccharomyces/
References:
Return to Jennifer's Molecular World