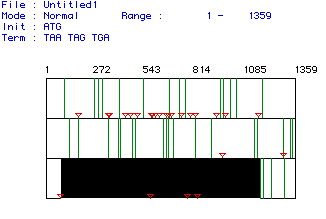
Image of the Open Reading Frame of Aldolase A

Figure 1. MacDNAsis was used to determine the largest
open reading frame (ORF) of aldolase A. In this diagram, every red
arrow represents a start codon and every green line a stop codon.
The largest open reading frame appears to go from amino acids 78-1172,
and is indicated by the black shaded area on the third frame.
To see the original cDNA sequence from the mouse, Mus
Musculus, that was used to generate this figure, click
here.
Molecular Weight of Aldolase A
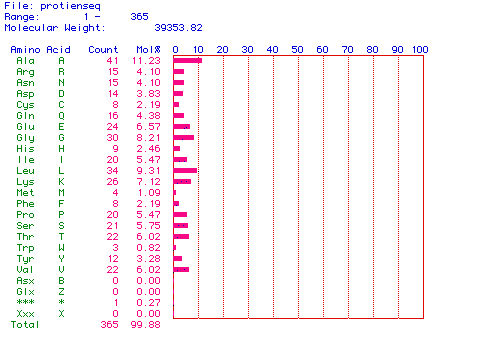
Figure 2. This graph shows the amino acid
composition of my protein. The most abundant amino acid appears to
be alanine. The molecular weight of the protein is also given to be 39353.82
daltons.
Kyte & Doolittle Hydrophobicity Plot of Aldolase
A
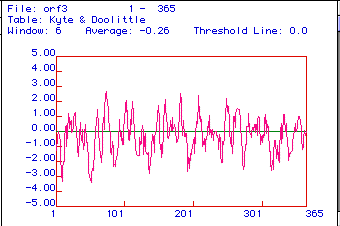
Figure 3. A Kyte & Doolittle Hydrophobicity
plot is used to determine if a protein is an integral membrane protein.
Areas with positive values are hydrophobic, and hydrophillic regions are
located below zero. If a region has a peak greater than positive
2, it is an integral membrane protein. Aldolase A appears to be an
integral membrane protein, with membrane spanning regions at amino acids
79, 184, 212, and 257. In addition this protein also appears to be
equally hydrophillic and hydrophobic.
Hopp & Woods Antigenicity Plot of Aldolase A
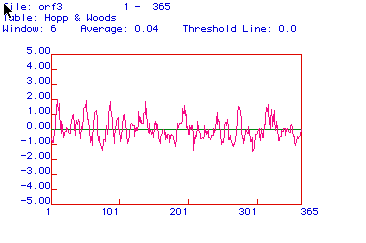
Figure 4. This figure predicts hydrophillic
regions, with positive regions showing hydrophillicity. The areas
with the highest positive values are the most hydrophillic, and may also
be the most antigenic. Although aldolase A is both hydrophillc and
hydrophobic, it does appear to have several strong hydrophillic regions.
These regions could be used to form a peptide, from which an antibody
could be made. I would choose to use the first region of the protein,
between amino acids 57 and 90, because these areas have several strongly
hydrophillic regions.
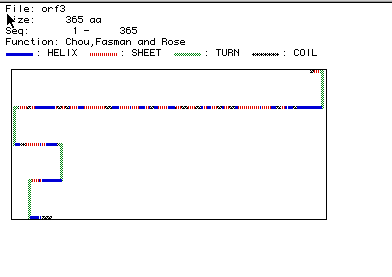
Predicted Secondary Structure of Aldolase A
Mutliple Amino Acid Alignment of Aldolase A in Five Species
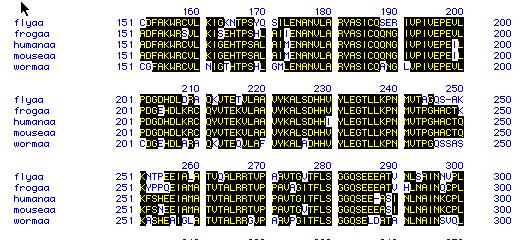
Figure 6. This figure shows the amino acid
sequence similarity between the five different species: fly, frog, human,
mouse, and worm amino acid sequences. Areas that contain the same
amino acid sequence are shaded in black, showing sequence alignment. Unshaded
areas show where a species has a different amino acid sequence. These
results show a high degree of amino acid sequence similarity between the
five species. To see the original amino acid sequences of each of
the above species click here: fly, frog,
human, mouse, and worm.
Phylogenetic Tree - Conservation of Amino Acid Sequence of Aldolase A

Figure 7. A phylogenetic tree can be used to determine how closely species are related, by examining how their DNA has been conserved through evolution. It appears that humans and mice are closely related, with a 97.2% similarity. There is also a high level of similarity between frogs, humans, and mice, with a 86.7% rate of amino acid sequence conservation. Flies and worms showed the greatest divergence, however, with only a 59% and 54.9% conservation rate respectively. Even so, with a 54.9% similarity between all species it appears that aldolase A has been well conserved during the evolution of each of these species. To see the original amino acid sequences of each of these species click here: fly, frog, human, mouse, and worm.