At tihs point, you know you have produced recombinant yeast IDH in E. coli. It is time to determine whether your IDH is functional or not.
1) Grow appropriate bacteria in 2 mL liquid cultures (LB + amp) until they reach the correct density (OD595 = 0.5).
2) Adde IPTG to a final concentration of 1 mM. Incubate at 37° C for about 4 hours.
3) Centrifuge cells for 2 minutes in a microcentrifuge (13,000 rpm), and aspirate the medium.
4) Resuspend pellet of cells in 0.2 ml cold 50 mM Tris HCl pH 8.0 and 2 mM EDTA.
5) Add lysozyme (100 µg/ml) and Triton-X 100 to 0.1%. Incubated the cells for 15 minutes at 30° C.
6) After a brief cooling period on ice, eliminate DNA contamination. Mechanically shear the DNA using a 27.5 gauge needle. Draw the entire volume of the lysate into a 3 ml syringe and repeat this 50 times.
7) Precipitated the lysate protein was by centrifugation for 15 minutes in a microcentrifuge (13,000 rpm). Resuspended the protein pellets in 100 µL IDH buffer and stored on ice. Save the supernatant on ice as well. Try one well with both the supernatant and the pellet as a pilot test.
8) Perform an IDH assay on both halves of the lysate from step 7 above. The basic protocol is as follows:
Well
|
Buffer*
|
NADP+ or NAD+
|
Recombinant Lysate
|
Isocitrate (last)
|
A1
|
200
|
0
|
0
|
0
|
A2
|
180
|
10
|
10
|
0
|
A 3
|
170
|
10
|
10 NADP+-dependent enzyme
+ control
|
10
|
A4
|
170
|
10
|
10
|
10
|
A5
|
170
|
10
|
10
|
10
|
A6
|
170
|
10
|
10
|
10
|
9) As soon as you add the substrate isocitrate, put the 96 well plate in the reader and read the absorption at 340 nm every 30 seconds for 3 minutes. You can do this by using an automated program supplied to you by the instructor.
10) Collect the printout and use Excel to plot the activity of your enzyme. Once you have done this, try the other coenzyme and compare the results. You can perform both experiments at the same time if you prefer.
Here are a couple figures to help you keep in mind what is happenging in this reaction.
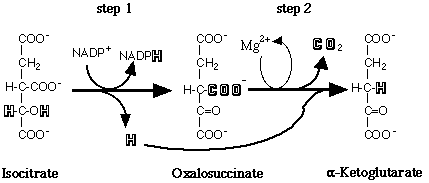
Figure 1. Summary of IDH reaction. Note the production of NADPH.
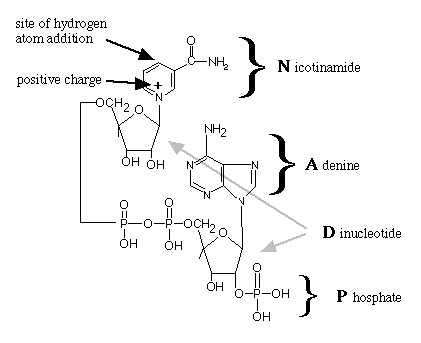
Figure 2. Structure of NADP+.
Lab Schedule In Context of Research Project