
this site is maintained by Nona Poulton under the supervision of Dr. A. Malcolm Campbell as part of the course requirements of Genomics at Davidson College, Davidson NC
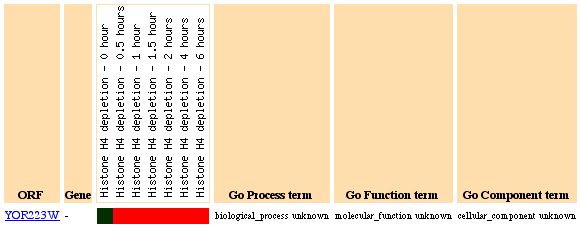
Characterization of RPB8 and YOR223W expression
RPB8 Function
RPB8 encodes a protein that is a subunit for DNA-dependent RNA polymerase. RNA
polymerase catalyzes the transcription of DNA into RNA using the four ribonucleoside
triphosphates as substrates. Each class of RNA polymerase is assembled from
12 different polypeptides. The RNA polymerase II of the fission yeast Schizosaccharomyces
pombe consists of 12 Rpb subunits, of which four (Rpb1, Rpb2, Rpb3 and Rpb11)
form the assembly and catalytic core and five (Rpb5, Rpb6, Rpb8, Rpb10 and Rpb12)
are shared among RNA polymerases I, II and III. This subunit is shared by all
3 yeast RNA polymerases (called subunit H), making it very important to the
yeast genome and proteome (Sakurai et al, 2002).
RPB8 Expression
Microarrays are one of the best methods for determining gene expression patterns
in an efficient and highly applicable manner. A good database supplying microarray
data is ‘Expression Connection’, part of the SGD website. Because
of its role as an RNA polymerase subunit, it makes sense that it would be highly
expressed under a variety of different conditions. One of the databases used
to look at gene expression profiles is Expression
Connection. This website is maintained by the Saccharomyces cerevisiae Database
and includes information from microarray data. The expression of yeast genes
in "wildtype conditions" was compared with the expression of genes
in each of eleven experimental conditions. I will only discuss a few of the
expression patterns of the given gene because they show a pattern of interest.
With this data, it is possible to see what genes may be regulated together or
what conditions induce or repress certain sets of genes. The data from each
of the eleven experiments can help classify my favorite genes a bit better,
using ‘guilt by association’ as a major deciding factor. Use the
scale below to see and compare the intensities of the red and green colors to
see the fold repression (green) or induction (red) from wildtype cells. Figures
1-7 come from the expression connection site.
(fold repression/induction)
a)
b)
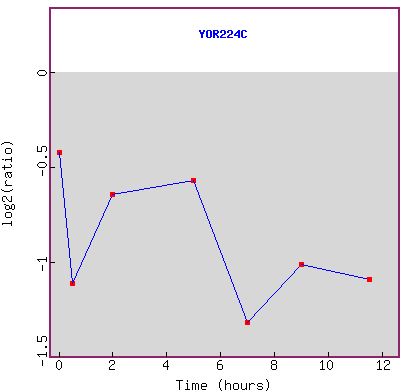
Figure 1a and b: Expression during sporulation. a) shows the
microarray data, where green indicates that the gene is repressed, and this
is true over the entire time course. b) shows the graph of the expression pattern.
RPB8 seems to have an overall trend of being more repressed as time goes on.
Because of background noise, it would be difficult to draw any other conclusions
than simply the gene is repressed under these conditions. However, the gene
is highly repressed during sporulation, which makes sense because the genome
goes through major changes directly before sporulation, requiring RNA polymerase,
but the process itself is not RNA-dependent. The cell would be wasting energy
if it were to make RPB8 because it would not be used during this time. Furthermore,
a literature search on microarray data for RPB8 shows no significant findings.
One website looked at the genomic specifics of sporulation, but even though
there appears to be a highly conserved repression pattern over time, the article
does not list RPB8 as one of the repressed genes. For more information, please
click here.
Figure 2: Expression pattern similarity to RPB8. The genes that exhibit the same expression pattern are all involved in protein synthesis, DNA synthesis, and intercellular trafficking, all processes that would be slowed during sporulation. The genes do not seem to be co-localized, but have similar functions in terms of cellular processes. GO term similarity search comes up with no definite matches, however.
Figure 3: Expression during glucose limitation. Slowly starving
a cell of its only viable food source causes many genomic events to occur. It
seems in the case of RPB8, glucose starvation causes steady induction (from
green to red over time). There are very few similarly expressed genes, which
makes it seem as though this gene is very important to the cells response to
glucose limitation.

Figure 4: Expression of RPB8 during the diauxic shift.
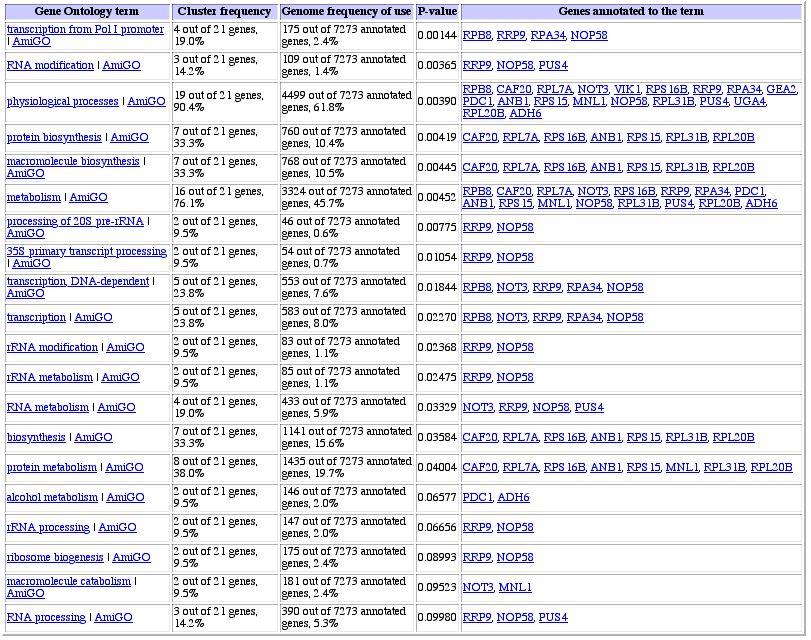
Figure 5: Similarly expressed genes during diauxic shift (Gene
Ontology link from Expression Connection site). Protein metabolism is the biggest
subset of genes that are co-expressed with RPB8, probably for the reasons discussed
above.
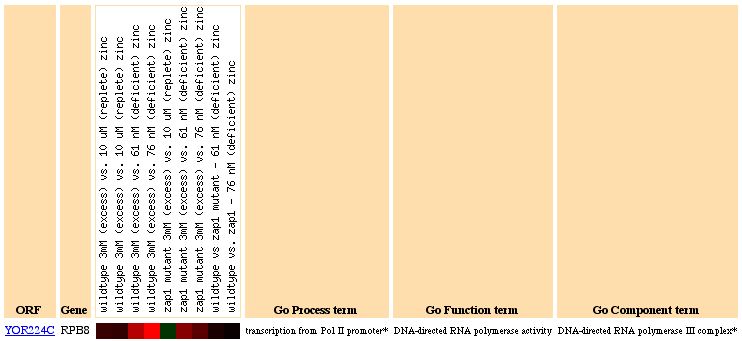
Figure 6: RPB8 Expression due to varying zinc levels. RPB8 is highly induced at most levels of zinc, suggesting that RNA polymerase is related to the intercellular zinc concentration level.
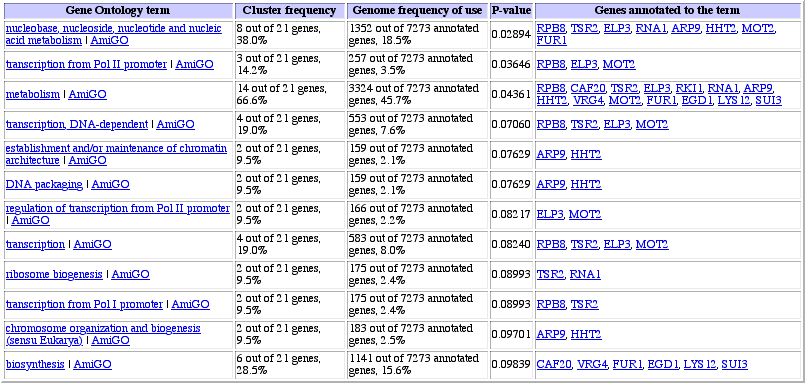
Figure 7: Similarly expressed genes under varying zinc levels
(Gene Ontology link from Expression Connection site). Again, it seems like RPB8
is clustered with metabolism and poylmerase genes, giving weight to the idea
of guilt by association.
Note: There is no significant expression pattern during the
cell cycle (or environmental changes), which is continuous with the fact that
RNA polymerase is used throughout the cell cycle, and is not induced or repressed
significantly during any particular phase. One interesting factor is that RPB8
is highly repressed, suggesting that the phosphorus dependency of the cell has
a repression effect on DNA and RNA synthesis (because of the guilt by association).
Function junction is another good microarray database search engine. From it
many different databases can be accessed, including the yeast microarray global
viewer, which gives many expression patterns for a given gene under many more
experimental situations. Figure 8 comes from this site.
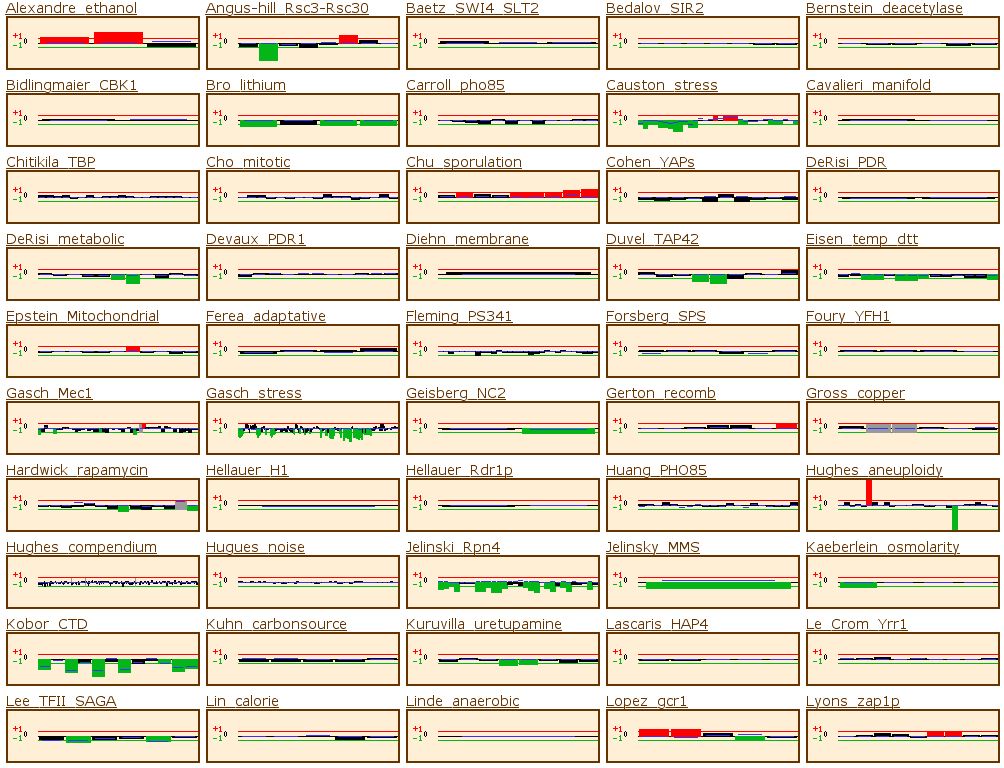

Figure 8: Microarray data from Funtion Junction. This set of
data shows the expression pattern of RPB8 during a variety of different experimental
situations. For this gene, the data from Expression Connection provides enough
information to explain its expression patterns, so I will not discuss any of
the data, but it shows how microarrays can provide a wealth of information.
DO Information (from Web Assignment #2)
Biological Process: Synthesis of RNA from DNA template via
RNA-polymerase (I, II, and III), of which RPB8 encodes a subunit. Synthesis
starts at the RNA-polymerase-specific promoter.
Molecular Function: As stated above, the biological function
of this protein is DNA-dependent RNA polymerase, where it functions as one subunit
of RNA polymerase I, II, and III. Here, it aids in the catalysis of DNA-template-directed
extension of the 3'- end of an RNA strand, one nucleotide at a time.
Cellular Component: RNA-polymerase initiates RNA synthesis
from DNA inside the nucleolus.
YOR223W Function
This gene is listed as unannotated, meaning the extent of the information known
about it is pretty much limited to its sequence. Based on sequence analysis
done on the previous web page, Web Assignment #2, I have these DO predictions:
Biological Process: Based on the information presented by
Donzeauf et al, YOR223W may be involved in the regulation of vegetative growth
and pseudohyphal development (the function of a 'G protein', or guanine nucleotide
binding protein).
Molecular Function: The function of the protein within the
cell is still unclear. It has been shown that the protein is not essential for
cell viability (from SGD YOR223W page), however. It is most likely involved
in growth and development, however, if it is a putative guanine nucleotide binding
protein.
Cellular Component: The protein is membrane-bound, as achieved
from the Kyte-Doolittle hydropathy plot results, thus it is probably in the
membrane.
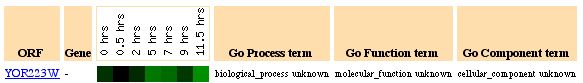
YOR223W Expression
Using the Expression Connection site once again, it is possible to classify
expression patterns of previously unannotated genes. Figures 9- come from the
expression connection site. The same repression/induction scale is used for
this data:
a)
b)
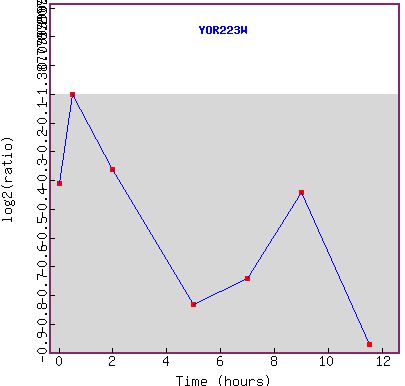
Figure 9a and b: Expression during sporulation. a) shows the microarray data. The gene seems to be repressed over the whole time course. b) shows the graph of the expression pattern. YOR223W seems to mimic RPB8 in that it become more and more repressed as time goes on. This suggests that either the gene is under the same promoter as its neighbor or has an independent repression system.
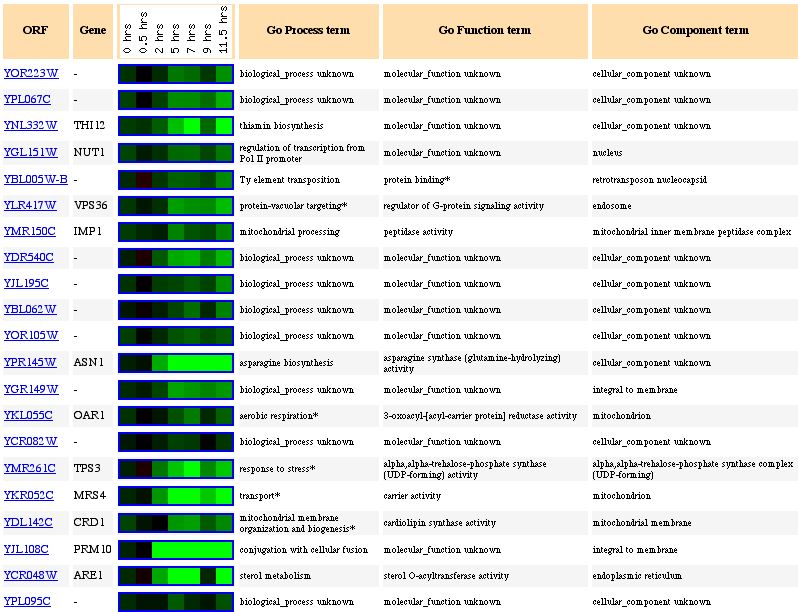
Figure 10: Expression pattern similarity to other genes. The
gene seems to be clustered with many different genes, many from different locations
in the genome. Some genes are involved in thiamin biosynthesis while others
seem to be transport or mitochondrial organization genes. It is obvious that
guilt by association will not work in this case because the genes in this cluster
have no functional similarities and we need more data to be sure of the function
of YOR223W.
a)
b)
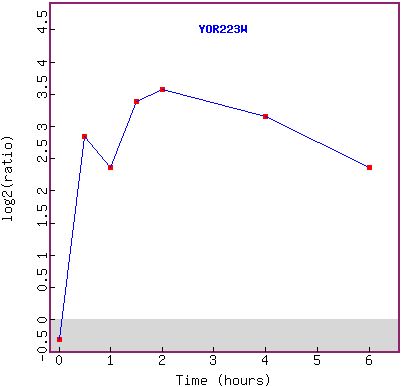
Figure 11a and b: Histone H4 depletion has a major effect
on the expression of YOR223W. The gene becomes highly induced over time (a),
beginning at 30 minutes (the second time point). The first reading (green) shows
that the gene was not originally being expressed in large amounts, but was in
fact being repressed slightly. The graph in (b) shows the expression pattern
over time.
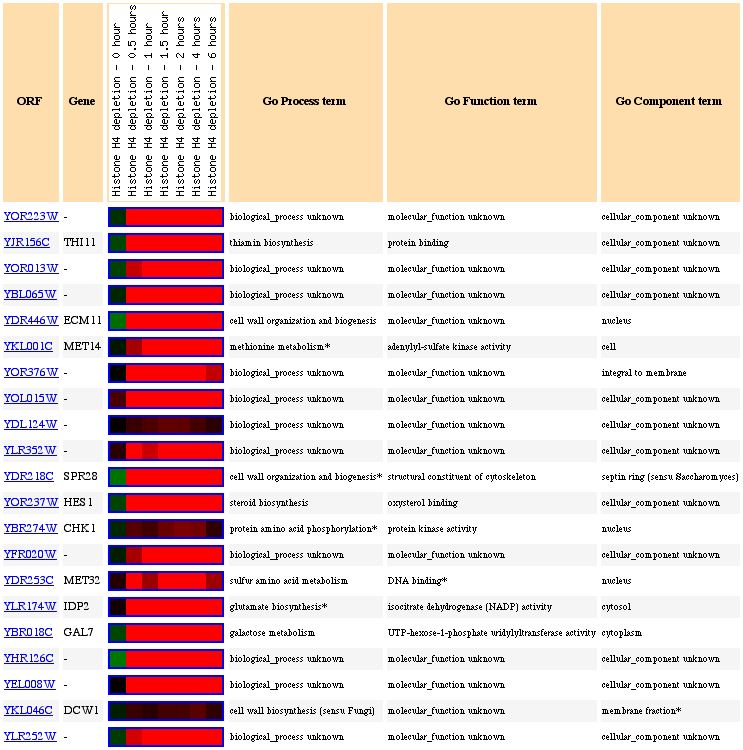
Figure 12: Expression pattern similarity. The genes that have similar expression patterns seem to be all over the place in terms of function.
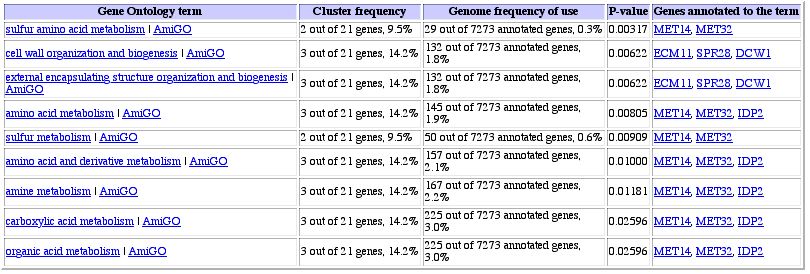
Figure 13: Expression pattern similarity in a table. When
one looks at the annotated genes, it seems as though there are two groups of
genes involved here: structural organization genes and amino acid metabolism
genes. It is impossible to tell from this data alone to which category YOR223W
belongs.
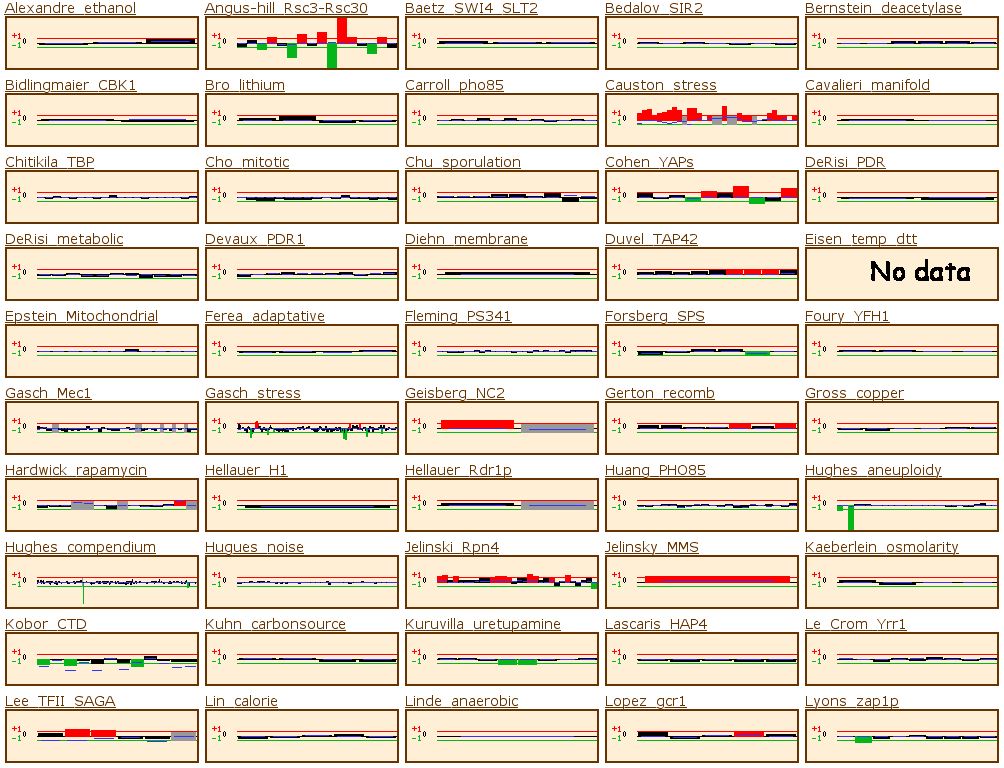
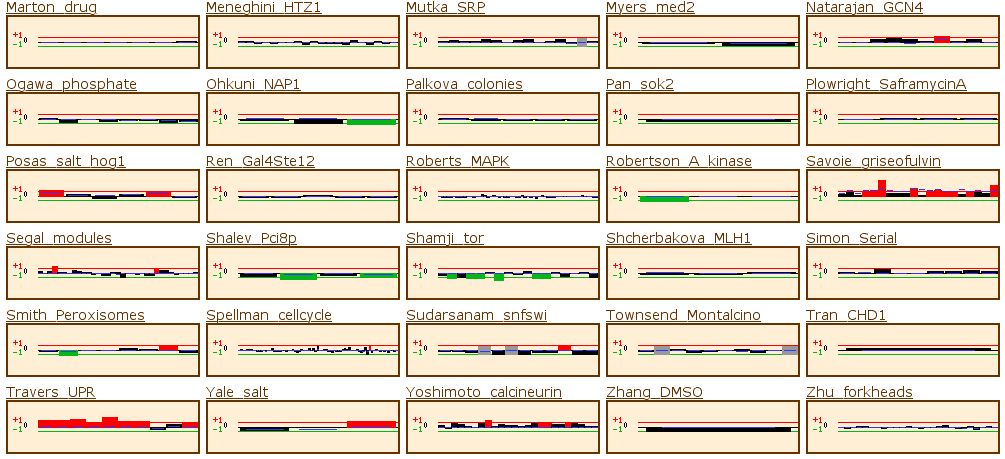
Figure 14: The yeast microarray global viewer shows the same experimental data set as for RPB8. The Causton stress test showed that the gene was high induced under a high salt or peroxide environment. The experiment labeled Travers_UPR also shows high induction. Travers UPR is listed as being a test for the coordination between the unfolded protein response and ER-associated degradation. This final piece of information enables us to group YOR223W into one of the two groups discussed above.
Note: No change during glucose limitation, cell cycle, diauxic
shift, DNA-damaging agents, or alpha-factor changes. Environmental changes have
some effects in terms of heat shock, but most of the crucial data is missing,
so no conclusive proposals can be made.
Updated GO predictions for YOR223W:
Biological Process: YOR223W can be more fully categorized based
on the information from DNA microarrays. Due to the wealth of information, I
can now predict that the function is not that of a G protein, but the gene is
involved in cellular organization. It is possible to make this prediction because
of guilt by association.
Molecular Function: My prediction about the molecular function still
hold true to an extent. We now know that it is not only crucial for cell viability
(discussed on the previous page), but we know that it is probably required for
cellular oragnization processes, especially those that are important to the
life of the cell.
Cellular Component: I know from my last page that YOR223W is membrane-bound,
so by guilt by association, I can group it with ECM11 and SPR28 and say that
it is probably involved in cell membrane organization and biogenesis. According
to the findings on WWeb Assignment #2, it is found in
the membrane and no data presented on this page refutes this finding, so there
is a good chance that it is an integral membrane protein.
References
Chu S, DeRisi J, Eisen M, Mulholland J, Botstein D, Brown PO, Herskowitz I (1998).
The transcriptional program of sporulation in budding yeast. Science. 282(5389):
699-705.
DeRisi JL, Iyer VR, Brown PO (1997). Exploring the metabolic and genetic control
of gene expression on a genomic scale. Science 278(5338): 680-6.
Lyons TJ, Gasch AP, Gaither LA, Botstein D, Brown PO, Eide DJ (2000) Genome-wide
characterization of the Zap1p zinc-responsive regulon in yeast. Proc Natl Acad
Sci U S A 97(14):7957-62.
Sakurai, H and A. Ishihama. (2002). Level of the RNA polymerase II in the fission
yeast stays constant but phosphorylation of its carboxyl terminal domain varies
depending on the phase and rate of cell growth. Genes Cells. (3): 273-84.
Wyrick JJ, Holstege FC, Jennings EG, Causton HC, Shore D, Grunstein M, Lander
ES, Young RA (1999) Chromosomal landscape of nucleosome-dependent gene expression
and silencing in yeast. Nature 402(6760): 418-21.
Web References
© Copyright 2003 Davidson College, Davidson, NC 28035