This web page was produced as an assignment for an undergraduate course at Davidson College.
My Favorite Yeast Proteins:
SSH1 & YBR285W
By Jessica Lahre
In the previous webpages, the yeast genes SSH1 and YBR285W have been investigated thoroughly using a variety of resources to determine their ontology and expression profiles. The purpose of this website is to use proteomic databases extend our insight into the two genes by examining the functions and interactions of the proteins these genes encode for.
SSH1
Recall
SSH1 is located on Chromosome II of Saccharomyces cerevisiae. This annotated gene is not an essential gene that encodes for the alpha subunit of the SSH1 Translocon Complex of the Endoplasmic Reticulum. It has also been suggested that while not only located in the ER membrane SSH1 is located in the nuclear-ER enveleope. Its functions involve co-translational targeting, protein transport, and maintenance of chromosomal telomeres.
DIP Database
In the Database of Interacting Proteins (DIP) I was able to search for SSH1p, the protein that SSH1 encodes for and finds its interactions with other proteins. DIP also provided information about the localization, function, and process of SSH1p. According to DIP, SSH1p is localized in ER membrane as part of the nuclear envelope of the ER and more specifically the translocon complex. Its biological process is co-translational membrane targeting and its function is protein transport. DIP also provides links to other resources and databases to provide further information on SSH1 and SSH1p. Below is the information that DP provided with a search for SSH1.
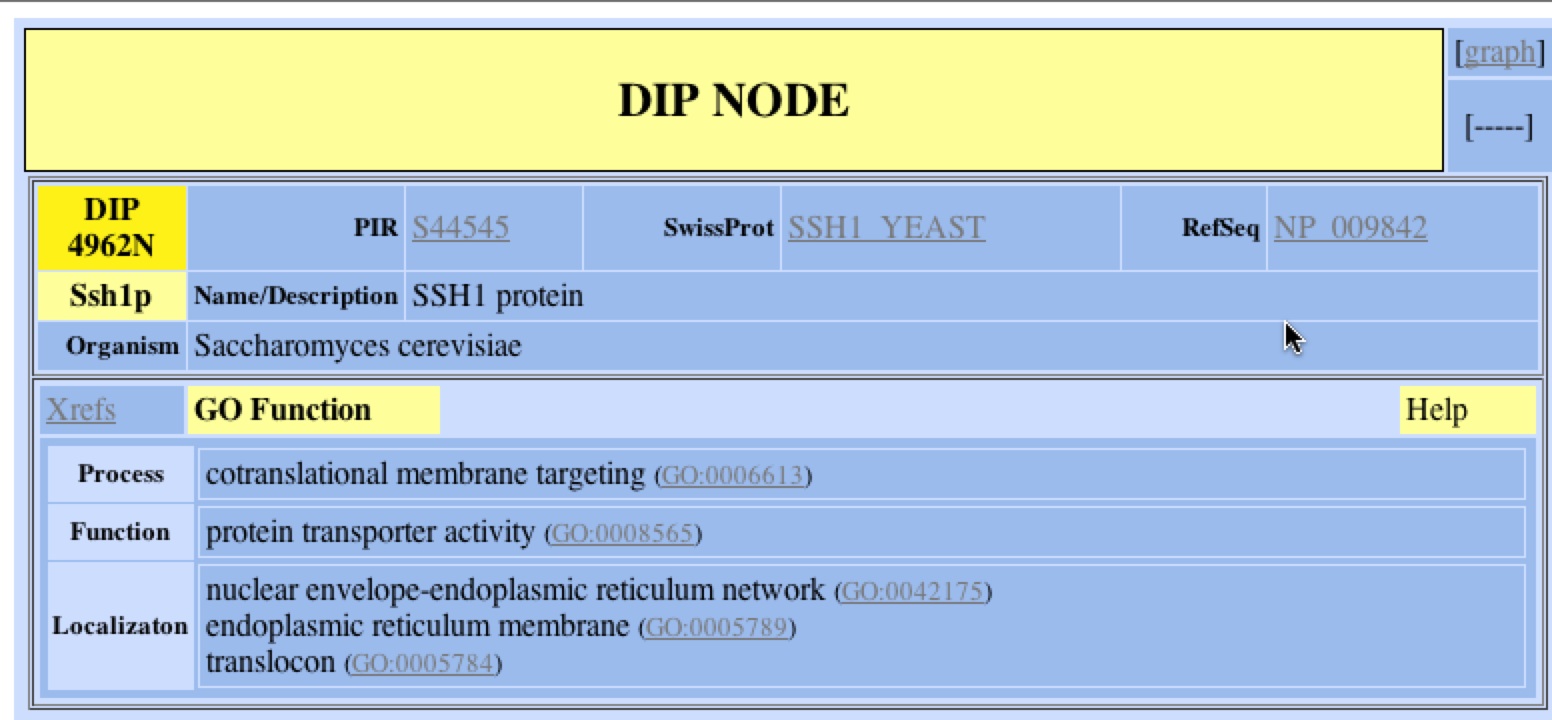
Figure 1. DIP’s GO function of SSH1p. Using DIP, one can find out the localization, function, and biological process of SSH1. One can refer to other resources such as GenBank, SwissProt, or PIR to learn more about SSH1 and SSH1p clicking on the respective links. One can also look at a graphical representation of the protein interactions of SSH1p by clicking the link (DIP 2006)
DIP also provides a graphical representation of the protein-protein interactions with SSH1p. Based on the representation, SSH1p interacts with Suc2p (right orange node), which functions in sucrose metabolism, and YLR311C, which has an unknown function.
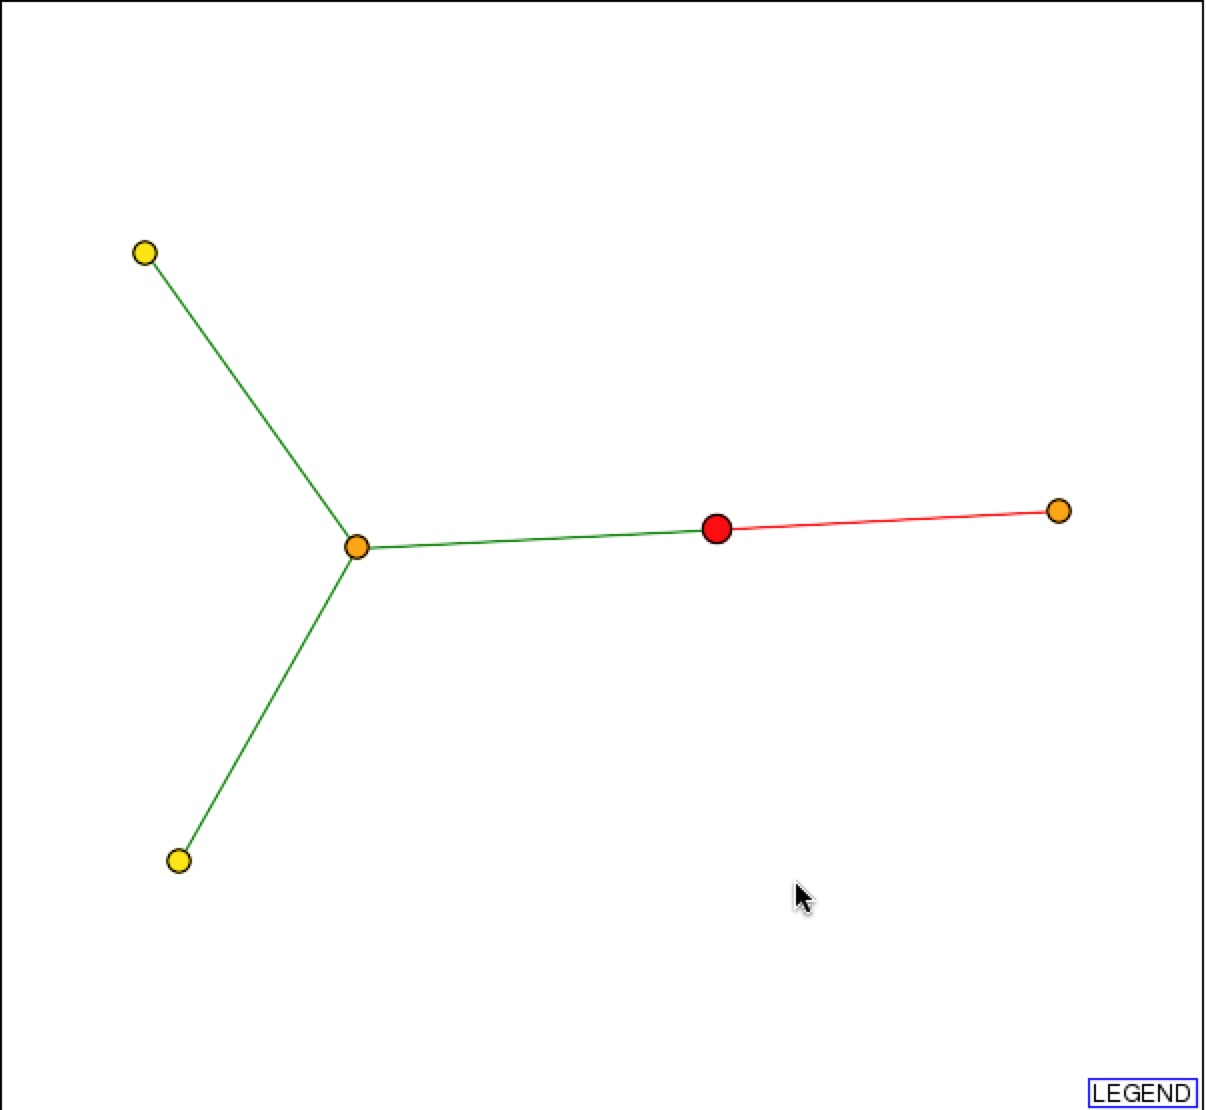
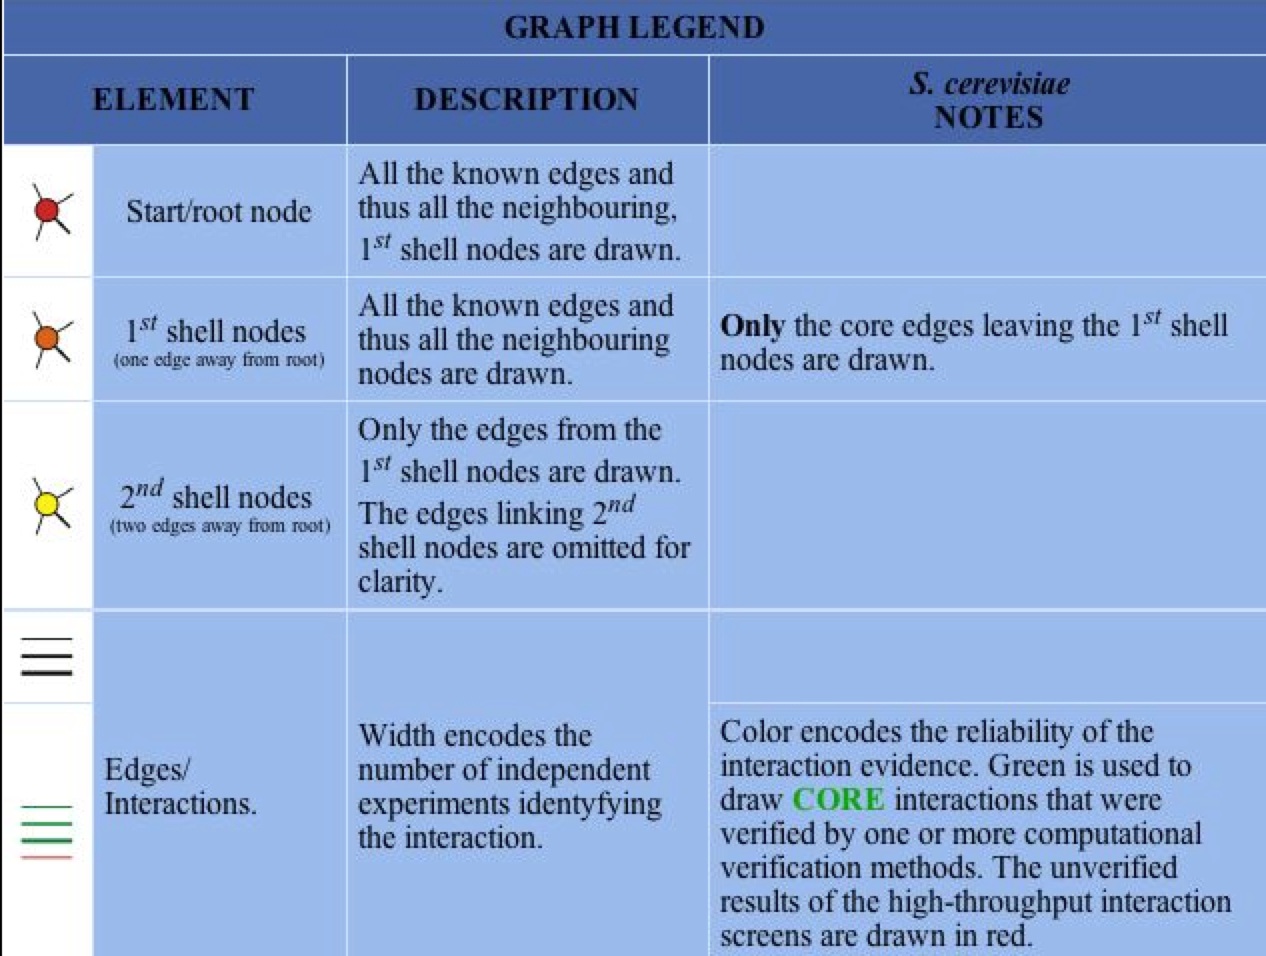
Figure 2 & 3. Graphical Representation of protein-protein interactions with SSH1p and figure legend. Figure 1 is a graphical representation of the protein interaction with SSH1p. SSH1p is the red circle/node that branches to two other 1st shell nodes. Figure 2 is the figure key and describes what the nodes and edges represent (DIP).
MIPS Database
The MIPS database provides extremely usual factual information on genes and their proteins. When searching for SSH1, One can find everything from the functional category that the protein is in, to the pathway, to the localization to the target pathway. One learns that SSH1p is involved in protein transport and “non-vesicular ER transport”, while this determining the destiny of the translated proteins in the ER (MIPS 2006). MIPS supports DIP’s fact that SSH1p is involved in the co-translational pathway and is localized in the ER and nuclear-ER envelope.
MIPS also provides physical features of SSH1 including that it is 490 amino acids long with an isoelectric point of 8.19 and a molecular weight of 53.312 KDa. It also provides the 9 transmembrane domains along the 490 amino acid sequence (MIPS) as supported by SGD used in the previous websites
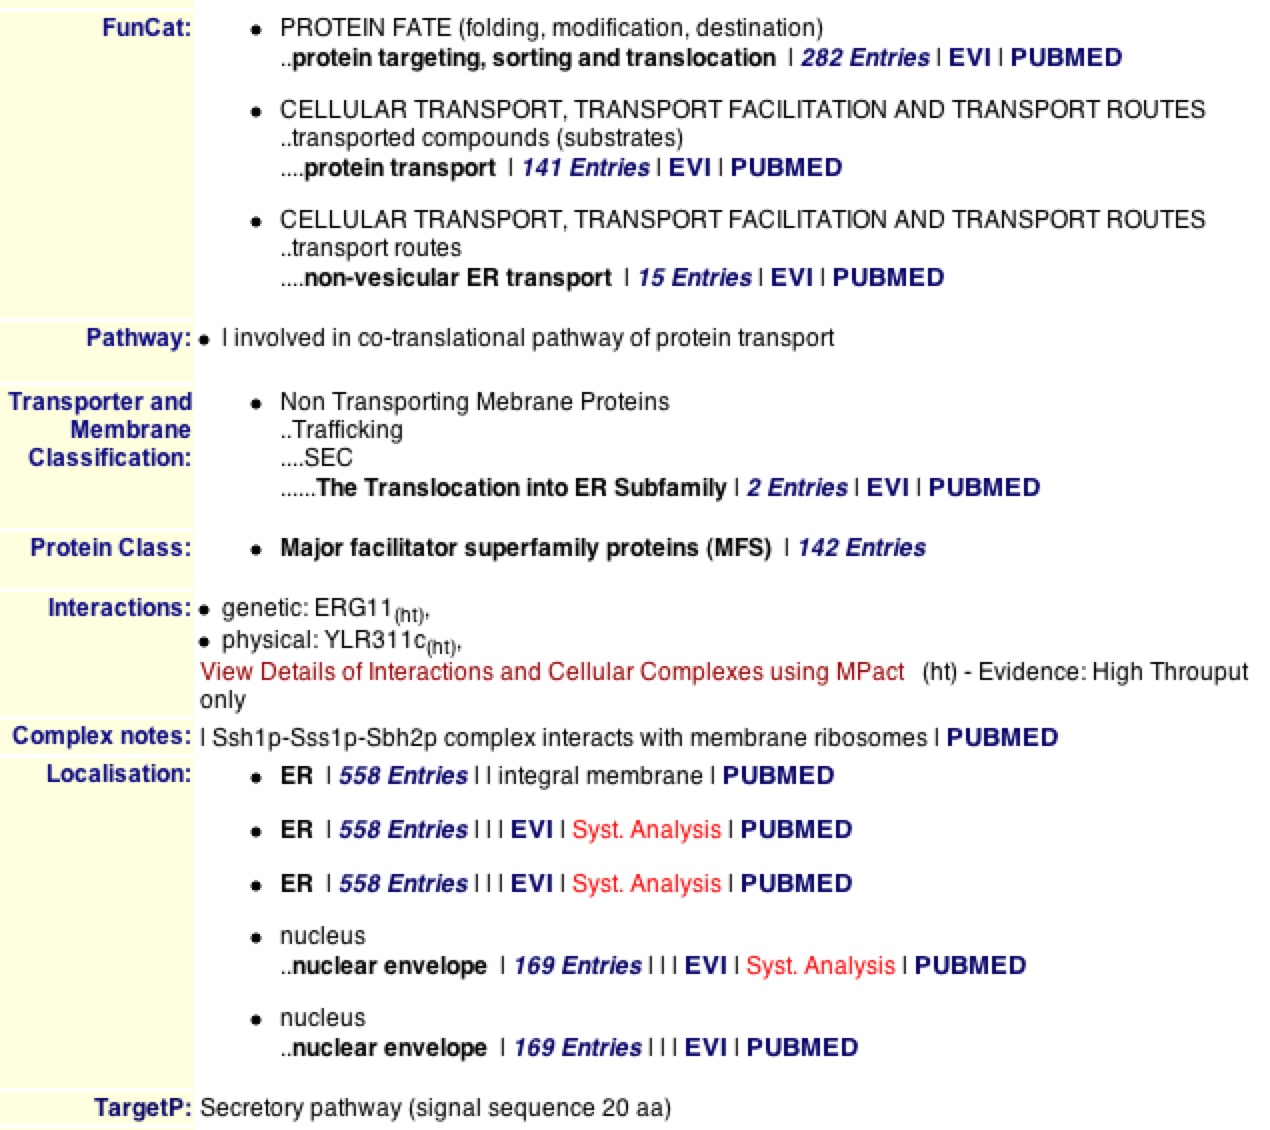
Figure 4. MIPS information on SSH1 and SSH1p. The MIPS database provides physical, sequential, and functional qualities of SSH1 and SSH1p. Looking at the list of facts one can find out that SSH1p is involved in co-translation of proteins and can be found in the ER and nuclear-ER envelope.
When looking at interactions, one can see that MIPS agrees with DIP in that SSH1p interacts with YLR311C. It is noteworthy to see that the database denotes this as a physical interaction. On the contrary, MIPS adds that SSH1 has a genetic interaction with the gene ERG11. MIPS also states that SSH1p interacts with SSS1p and SBH2p in the complex they form on the ER (MIPS). If one clicks on “View Details of Interactions…" one can bring up a list of the interaction and information about both proteins and genes that interact (figure 5).
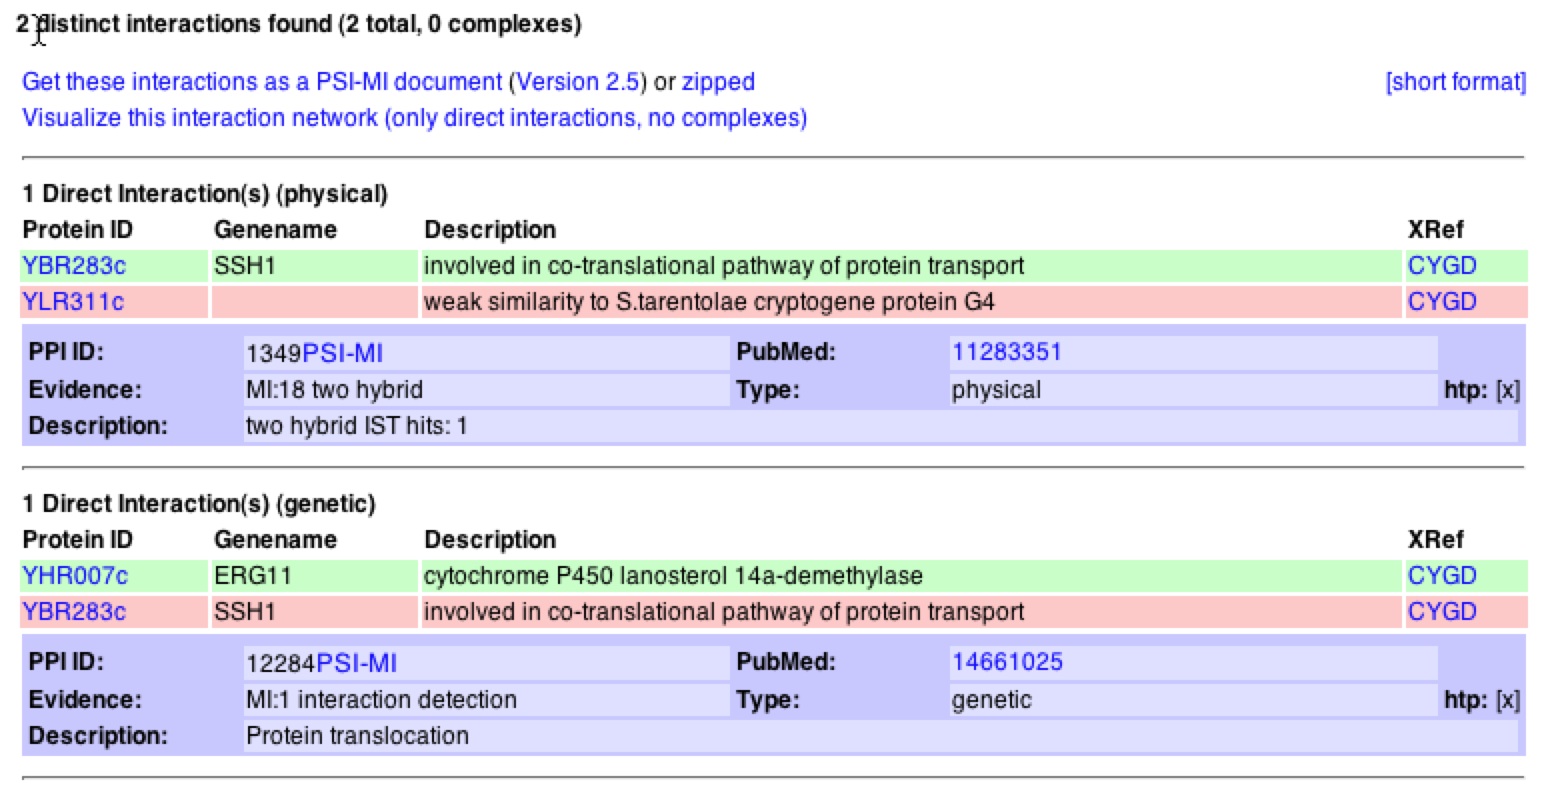
Figure 5. Interactions with SSH1 from MIPS database. The link shown above describes the 2 interactions that SSH1 has with other proteins/genes. One can see that SSH1 has a physical interaction with YLR311C and a genetic interaction with ERG11.
SGD
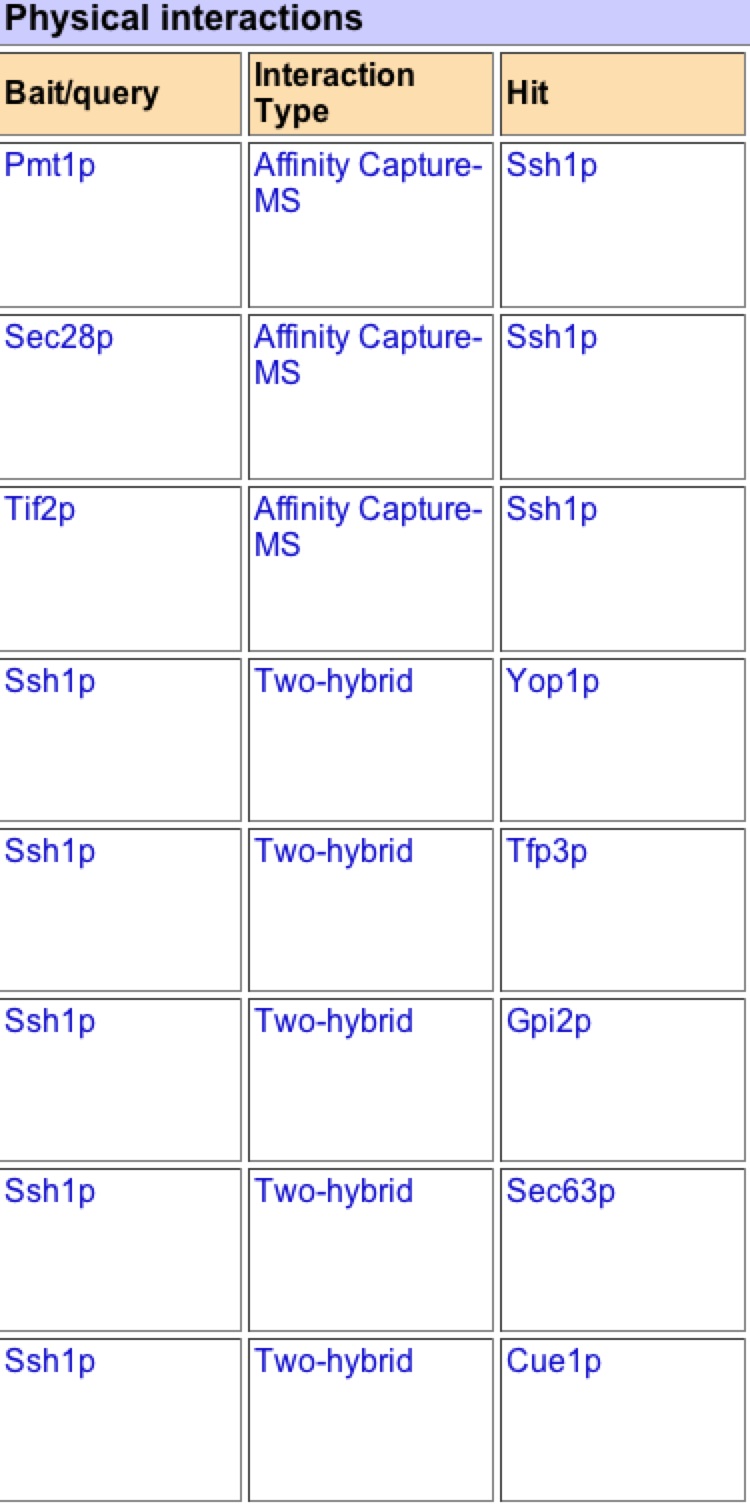
SGD provides a completely different list of interactions of SSH1 with 25 physical interactions and almost triple the amount of genetic interactions. It is intersting to see that neither Suc2p or YLR311Cp are on the list. Although if one scrolls through the numerous genetic interactions, one will find ERG11 (SGD 2006).
BIOGRID
BIOGRID is a database a lot like DIP in that it describes the function, process, and localization of SSH1 and provides a graphical figure to visually display the possible interactions between SSH1 and other proteins. BIOGRID supports the previous websites and databases facts that SSH1 is one of the 3 subunits in the SSH1 translocon complex and is involved in co-translation of protein transport. It lists the function as a protein transporter, the biological process as both co-translation and telomere preservation, and its localization in the ER, nuclear-ER envelope, and specifically in the translocon complex. It also provides links to other databases for more information.
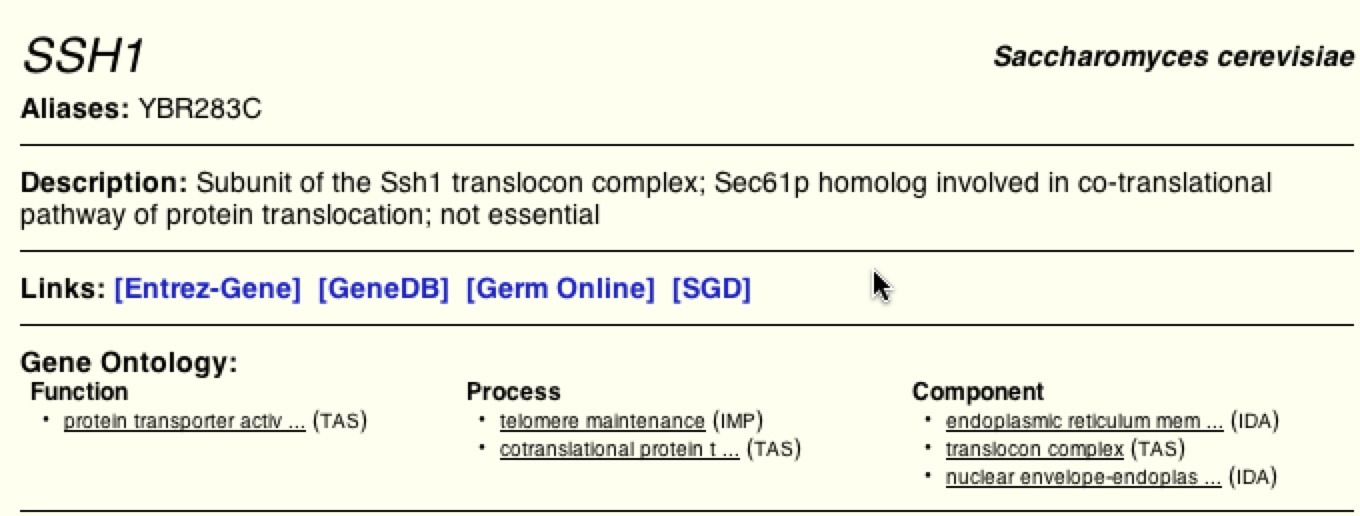
Figure 6. Visual frame of the SSH1 results from BIOGRID. This shows the screen of the results for SSH1 from BIOIGRID. It provides function, process, and location of the SSH1p as well as links for more information.
Below is the graph from BIOGRID on SSH1’s interactions (figure 7).
As one can see this graph is drastically different than figure 2. BIOGRID lists 59 interactions with SSH1p based on this graph, but unlike MIPS it is unknown if these interactions are physical or genetic based on the graph. BIOGRID then provides a list of all 59 interactions with the gene’s name, a description of its function, and then the type of tests used that proved the interaction (figure 8)(BIOGRID 2006). Using this interaction data supports how BIOGRID determined SSH1’s function, process, and component. It is interesting to see that YLR311C is not on the graph or list of interactions, while Suc2 and ERG11 are present. It is significant to see how many more interactions BIOGRID gathered than MIPS and DIP databases. One must be cautious of this data because who knows what the researcher’s standards were for defining interaction and one might question is this outlier just an outlier or should more researchers look further into these interactions. |
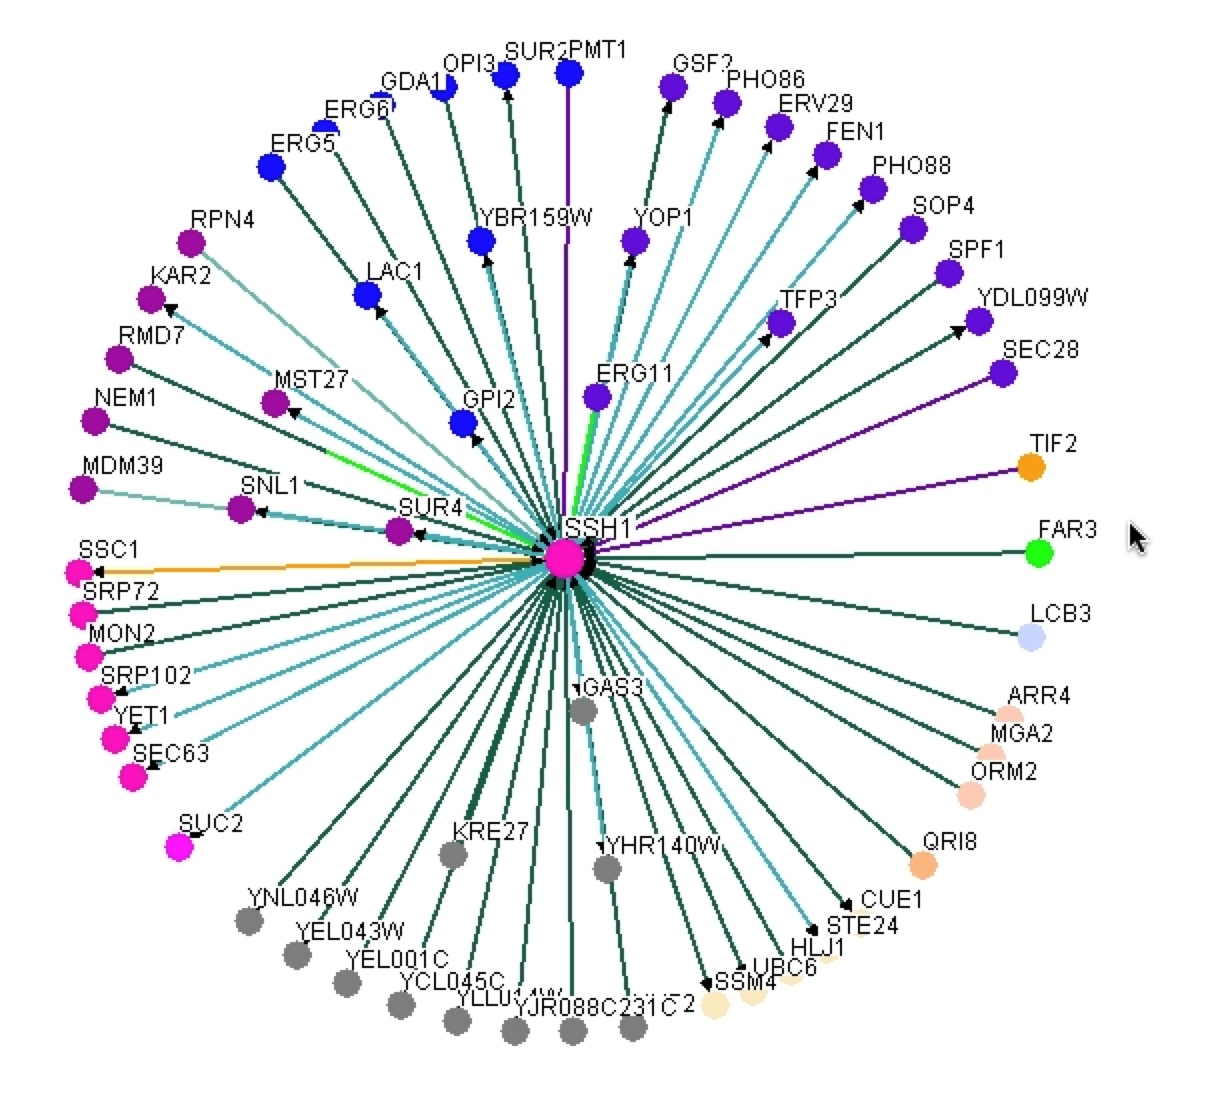
Figure 7. Graphical representation of SSH1’s interactions from BIOGRID. One can see SSH1 as the central node in the middle and then the edges jetting out of it in all directions to other colored nodes indicating the 59 interactions SSH1 has.
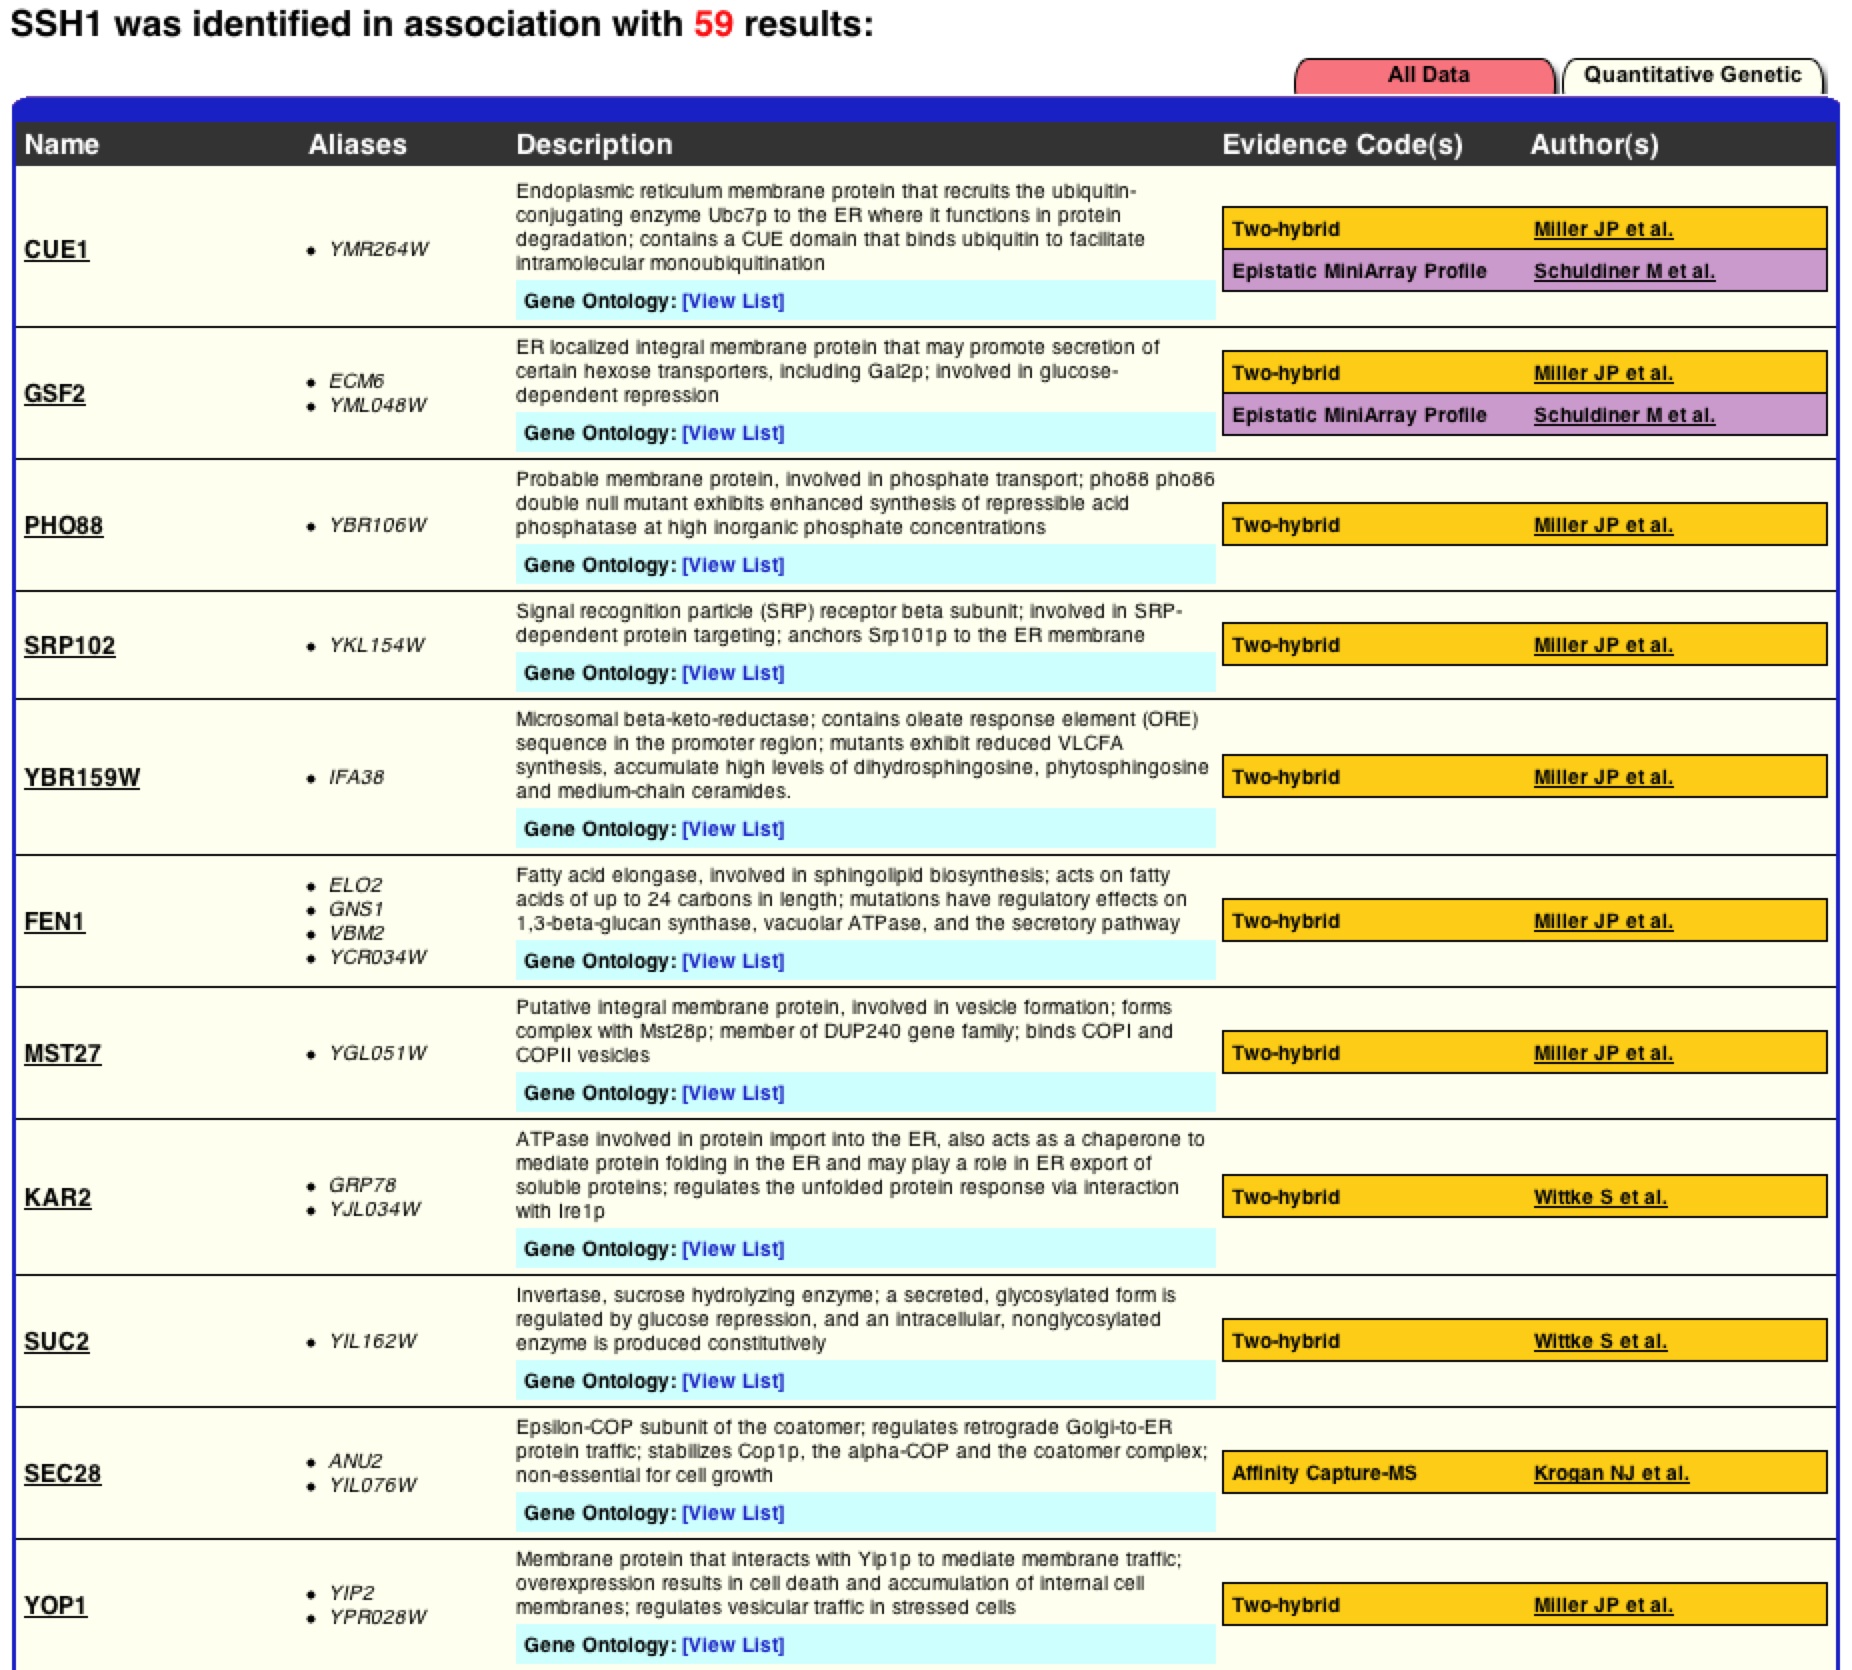
Figure 8. List of SSH1’s interactions from BIOGRID. This list is the first 11 interactions of the BIOGRID list for SSH1. One can see Suc2 at number 9.
BIND
BIND is another database that provided another different list of interactions with SSH1. This database complied evidence from a variety of tests in yeast, humans, and mice. It distinguishes which protein was each label and the specific test used to identify the interaction. One can see that ERG11 and YLR311C did make the list but Suc2 did not.
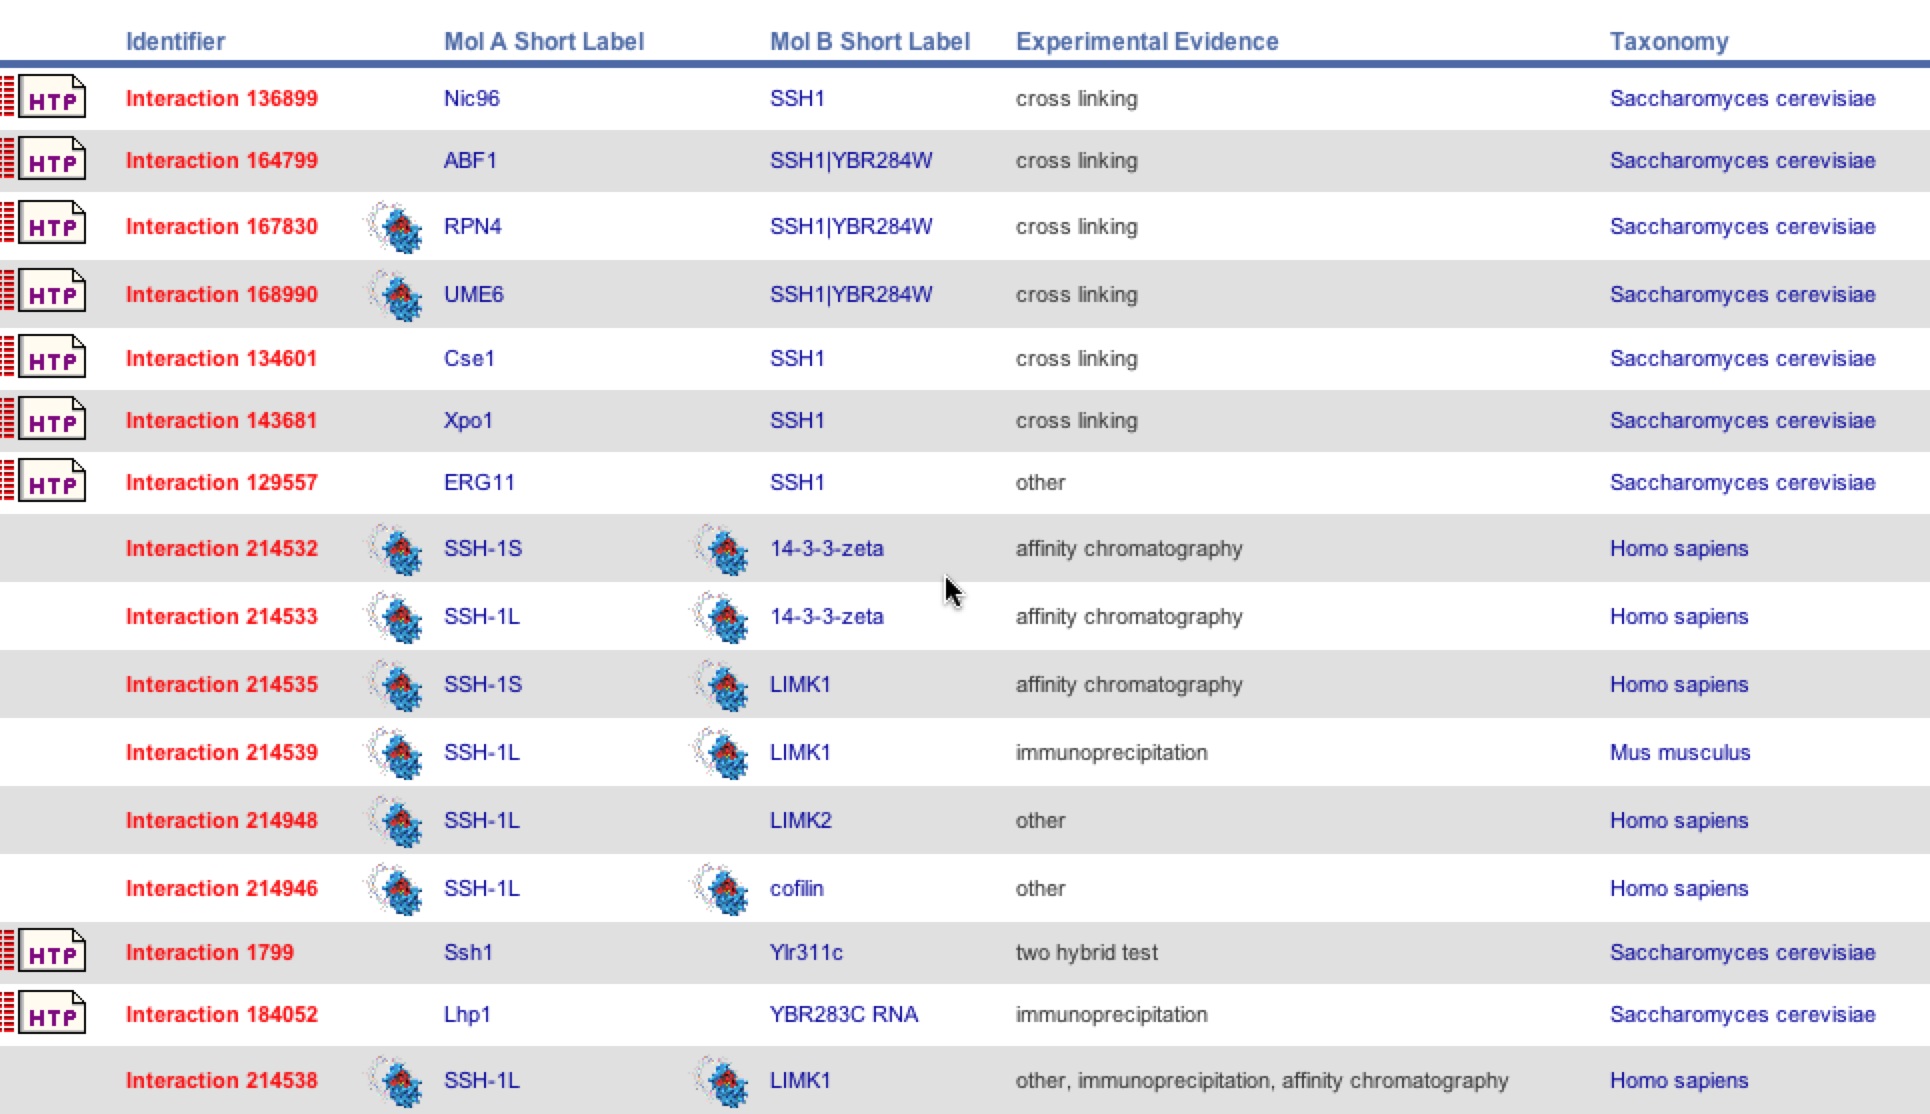
Figure 9. BIND list of SSH1 interactions. The figure below is the site frame of the SSH1 interactions in yeast, humans, and mice using different types of tests such as Y2H, cross linking, and affinity chromatography.
ModBase
Collecting from a wide range of sources, ModBase has constructed this structure of SSH1p. The database provided other filter models, but this had an E-value of 0.00 units. One can see large number of alpha helices that are labeled in different colors. The site provides the cross-references used in collecting the information.
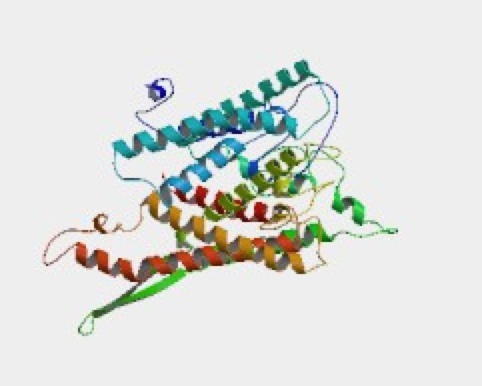
Figure 10. Visual image of SSH1p. This image of the tertiary structure of SSH1p shows how the 490 amino acid sequence reflects in the multiple alpha helices.
Conclusion
The information given from these databases further supports the previous websites' views on location and function of SSH1. It seems that most likely SSH1 interacts with YLR311C and Suc2 at the physical level and ERG11 on the genetic level. As for the discrepancy as to the actual number of interactions SSH1 has exactly is still unclear due to the differing evidence between databases. It can be concluded that SSH1 is involved in protein transport, telomere maintenance, and the co-translational pathway in yeast. This data was consistent throughout the databases. While it is extremely helpful to have annotations on a given gene or protein, one must be cautious as to what is true or not as seen with SSH1’s interactions.
Other Databases: These databases were searched, but provided no information or relevant information for this website or the previous websites.
YBR285W
Recall
| While it still is unclear the specific biological process, cellular component, and molecular function of YBR285W, there has been some speculation based on the previous websites. From the previous websites, YBR285Wp has no transmembrane domains and is predicted that it could possibly function in the Golgi complex with sorting, packaging, and transporting due to the high identity to YJL029C, a potential paralog. It is known that systematic deletion of the gene allows the cell to still be viable, thus it is not an essential gene. Looking at the microarray data, and using guilt by association from the clustering, I would predict that YBR285W is involved in metabolism of reserve energy, especially lipids. Most of the data supported the previous website’s claim that this is a cytosolic protein. |
DIP Database
The DIP when searching for YBR285W did not produce any information on the localization, function, and process of the gene. It did provide a graph of the YBR285W interactions as shown below (figure 11). According to DIP YBR285Wp interacts two proteins: Tpo3p, which has an unknown function and Dfg10p, which is involved in growth of pseudophayls. These two proteins are distinguished by the two orange nodes connected to the red central node (YBR285Wp).
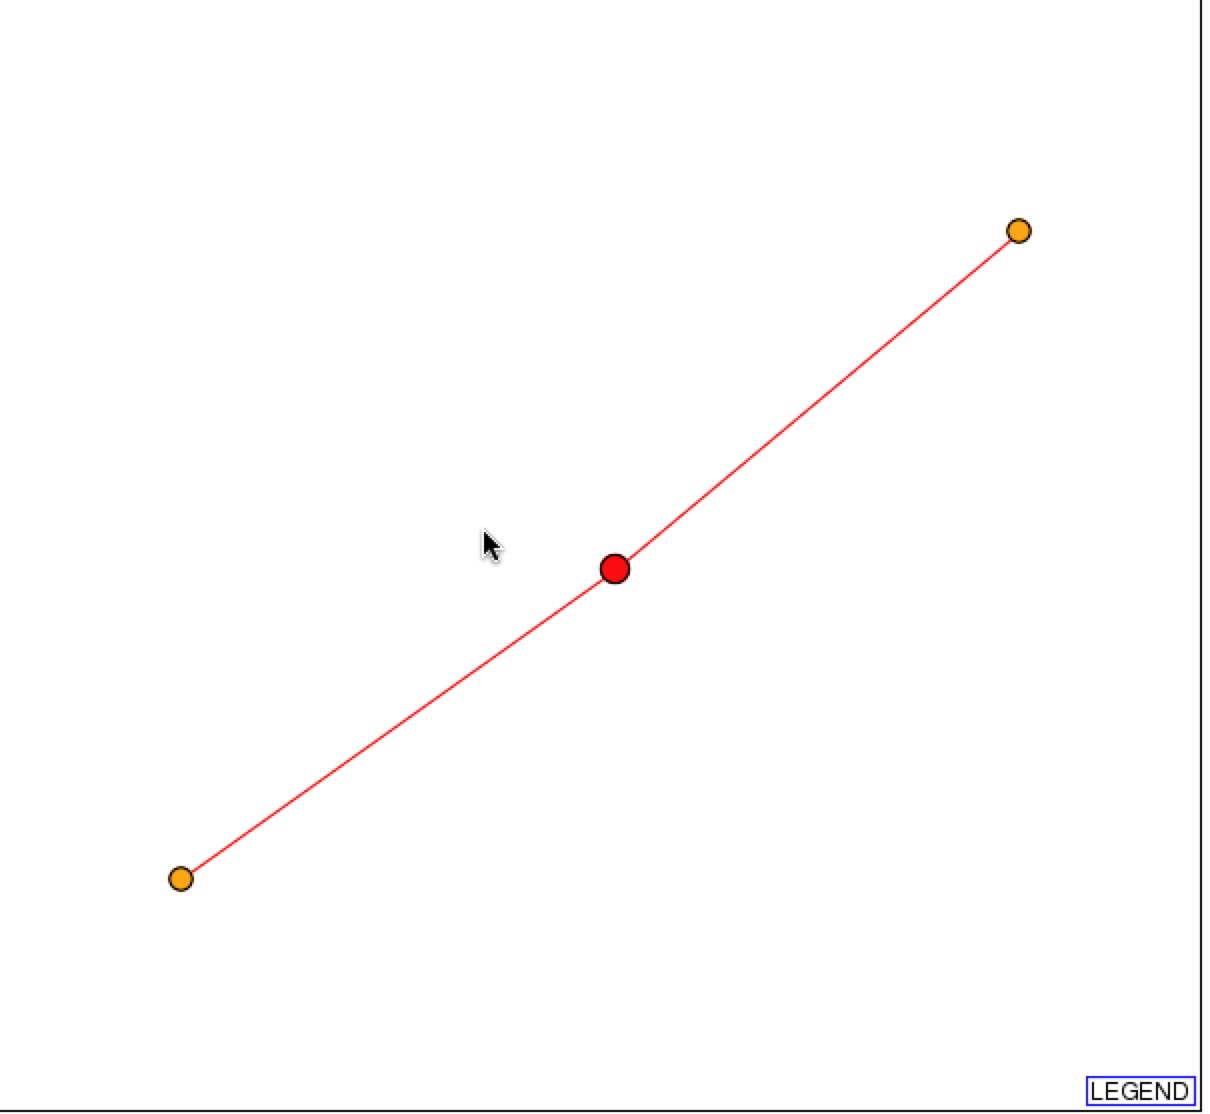

Figure 11 & 12. Graphical representation of protein-protein interactions with YBR285Wp and figure legend. Figure 11 is a graphical representation of the protein interaction with YBR285Wp. YBR285Wp is the red circle/node that branches to two other 1st shell nodes. Figure 12 is the figure key and describes what the nodes and edges represent (DIP).
MIPS Database
The MIPS database also was unable to identify the exact function and process of YBR285W, but did localize the protein in the cytoplasm of the cell. It also listed that YBR285W has two physical interactions with Dfg10 and Tpo3, supporting DIP’s graph.

Figure 13. MIPS frame shot of results for YBR285W. This figure is a frame shot of the results for YBR285W and supports that the function and process of YBR285W are unknown.
When one clicks on the “View Details of Interactions…” one will bring up the figure below (figure 14). This shows the physical interactions of YBR285W and the specifics of Dfg10 and Tpo3 and that Y2H tests were used to provide evidence.
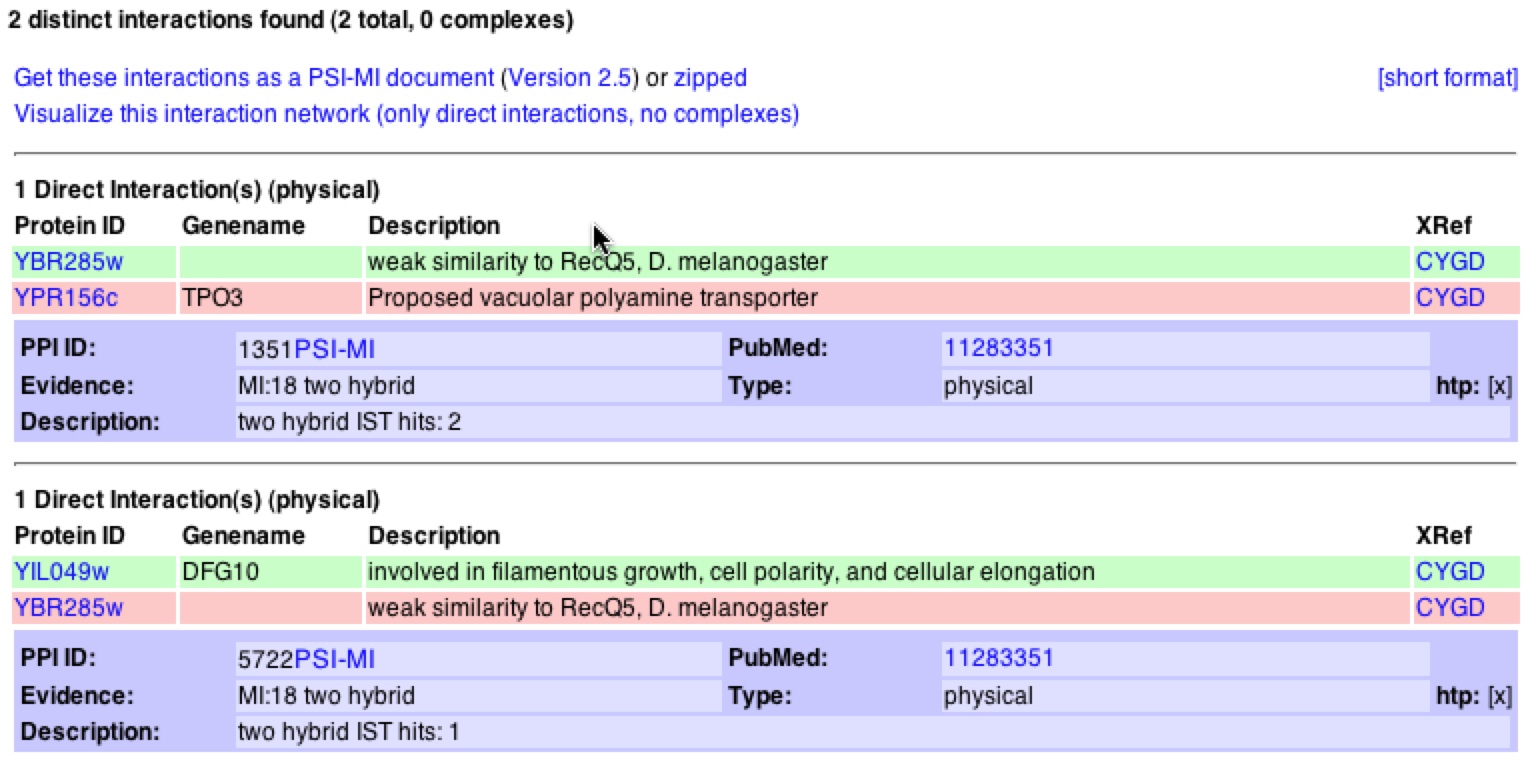
Figure 14. Interactions with YBR285W from MIPS database. This figure shows the physical interaction of YBR285W with Dfg10 and Tpo3. Both databases used Y2H method to provide evidence of interactions.
BIOGRID
BIOGRID further supports that YBR285W interacts with Dfg10 and Tpo3 (figure 16). Although BIOGRID, like the other databases, has no distinct facts identifying the biological process and molecular function of YBR285W it does say that it is similar to YBR287W, which if mutated, leads to reduction in growth. SGD pulled their information from BIOGRID, thus to limit redundancy, SGD is not shown.
Even though the function is unknown, one can use the information that is known of the proteins it interacts with to use guilt by association to determine YBR2855W’s function and location. For instance, BIOGRID states that Tpo3 is in the plasma membrane and is a polyamine transport protein. Thus YBR285W could be associated with this transport pathway. |

Figure 15. Results from BIOGRID of YBR285W. BIOGRID, like DIP and MIPS, does not have enough data to define the function and process of YBR285W.
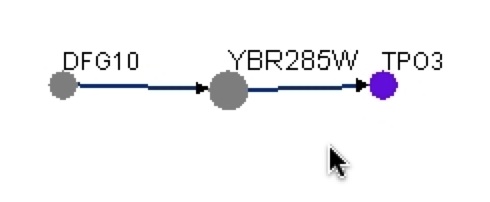
Figure 16. Graphical representation of protein-protein interactions with YBR285W from BIOGRID. This graph shows that YBR285W interacts with Dfg10 and Tpo3. This graph shows that Dfg10 interacts to YBR285W and YBR285W interacts to Tpo3.

Figure 17. Description of Dfg10 and Tpo3 and their interactions with YBR285W. This figure is a list of the proteins that interact with YBR285W showing that both use Y2H method to find the interaction.
BIND
| BIND was able to collect more data indicating that there are more interaction with YBR285W using other methods of detection besides Y2H like cross linking. As shown in figure 18 Dfg10 was identified, but not Tpo3 as a protein interaction. There were 7 other interactions identified besides Dfg10. As with SSH1, one must be cautious to these new interactions. |

Figure 18. BIND results for YBR285W. BIND came up with 8 total interactions with YBR285W including Dfg10, but not Tpo3. Two different methods were used to come up with this data: Y2H and cross linking.
Other Databases: These databases were searched, but provided no information or relevant information for this website or the previous websites.
Enzymes and Metabolic Pathways
Conclusion
In conclusion it is difficult to make a clear-cut decision as to what the specific function of YBR285W might be. Although we can make some predictions as to the possible pathways that the YBR285Wp is involved in using the microarray data from the previous websites and the protein interactions with Dfg10 and Tpo3. As the microarray suggested, YBR285W might be involved in the Golgi Complex and possibly lipid metabolism, its interaction with Tpo3 supports these claims through guilt by association. Tpo3 is a vacuolar polyamine transporter, which further supports the Golgi association and lipid metabolism because amino groups are an essential aspect of lipid metabolism. It would interesting to see some more experiments done on YBR285W to see if it interacts with mroe proteins than just Dfg10 and Tpo3. By doing so, we would be able to speculate more accurately the function of the gene and its protein. From SGD they collected data establishing that if YBR285W was knocked out the cell was still viable thus amking it a non-essential gene. I think more yeast two-hybrid method or Y2H experiments need to be done to expand the protein-protein interactions of YBR28W. For this experiment YBR285Wp would be considered the bait protein bound to the DNA Binding Domain (DBD). Then a variety of other proteins would be bound to the Activation domain and act as the prey. The two, bait and prey, must be fused for transcription to occur. When they are separate, neither complex can initiate transcription on its own. It would also be interesting to have YBR285W act as the prey and other proteins be the bait and see the similarities and differences compared to when YBR285W is the bait. I would expect proteins that are involved in vacuolar transport or lipid metabolism to successfully allow fusion to occur. Knowing the quantity of YBR285W is produced under different conditions would be valuable significant. You would use Chait's method of stable isotopes N14 and N15 and grow different samples of cells in different populations in the nitrogen isotopes. Thus then you could do a Mass Spectrophotometry to measure the quantity of proteins that were able to be expressed. Adding to this experiment, since phosphorylation plays a key role enzymatic activity, you could detect the difference in phosphorylation between the different population of cells. It is still unclear as to the localization of YBR285W because while some define the cellular component as unknown, a few databases have localized it in the cytosol. One could do an immunoprecipitation to determine the location using an immunoflourescent antibody able to bind to the protein YBR285W. Thus once the antibody is bound you can use tags localized to various distinct areas of the cell such as the cytosol or somewhere in the Golgi Complex. If the proteins bind to the tag, then you know that YBR285W is located there. |
References
(BIND) Biomolecular Interaction Network Database. 2006. <http://bind.ca/index.jsp?pg=0>. Accessed 14 Nov 2006.
BIOGRID. 2006. <http://www.thebiogrid.org/>. Accessed 14 Nov 2006.
(DIP) Database of Interacting Proteins . 2006. <http://www.yeastgenome.org/>. Accessed 14 Nov 2006.
Dolinski, K. et al. (2006). Saccharomyces Genome Database (SGD). <http://www.yeastgenome.org/> Accessed 15 Nov 2006.
(MIPS) Munich Information Center for Protein Sequences. 2006. <http://mips.gsf.de/genre/proj/yeast/index.jsp>. Accessed 14 Nov 2006.
University of California, San Francisco. (2006). ModBase. <http://modbase.compbio.ucsf.edu/modbase-cgi/search_form.cgi>. Accessed 15 Nov 2006.
For more information, please refer to the
Davidson College Genomics Home Page
Davidson College Biology Home Page
Back to my Home Page
E-mail me any comments or concerns
© Copyright 2006 Department of Biology, Davidson College, Davidson, NC 28035