This web page was produced as an assignment for an undergraduate course at Davidson College
Permission pending
Over the course of nine years, Denef and Banfield investigated the rate at which free-living bacteria evolved in an acid mine drainage environment in the Richmond Mine. The goal of their investigation was to use the evolution rate that they experimentally found to provide evidence for the success of recently evolved hybrids in the environment. The investigators chose the acid mine drainage environment because the biodiversity was very low, which reduced the selection pressure form interspecies competition. Additionally the environment was fairly undisturbed; although in the past both human and environmental events had purebred the environment.
Denef and Banfield studied the evolution rate of Leptospirillum, a free-living bacteria in the mine that forms a biofilm. This bacteria was chosen because previous research had shown that homologous recombination events had produced six different genotypes with the group II Leptospirillum and reference genomes for types I and VI had already been created.
To find the evolution rate of Leptospirillum, the investigators sampled a location, C75, that was dominated by type III bacteria over a five year period (2006-2010). The evolutionary rate was determined by the number of single nucleotide substitutions that fixed in the population from year to year. The investigators used high throughput Illumina sequencing to compare the genomes in each sample year to year. Because there were 1.7 million to 8 million reads per sample and each read was an independent measurement of population-level sequence variation, new, high-frequency, SNPs were readily detected. The evolution rate was found to be 1.4 x 10⁻⁹ substitutions per nucleotide per generation.
To control for a potential bias in evolutionary rate based on spatial orientation within a contiguous biofilm at location C75, compared samples from three different spots within the biofilm. The samples showed low levels of variation between each other, indicating that the evolution rate obtained was accurate.
Finally, the investigators compared samples of Leptospirillum from each test location to each other and found that each genotype present was comprised of a mosaic of type I and type VI genome blocks. The exact same transition points between blocks were found in each of the genotypes in every sample, which indicates each major recombination event occurred in a single cell. The investigators constructed a phylogenetic tree based on mutations from the type III genome that they created de novo from the existing type I and VI genomes.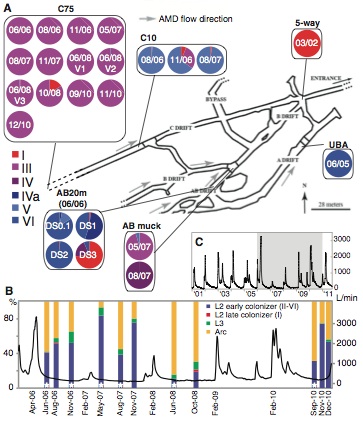
Permission Pending
The first panel provides a map of the mine from which the samples are being taken, with gray arrows indicating the direction of flow of the acid mine drainage. Sampling locations are indicated by black lines connecting the specific area on the map to the samples that were collected from that location. Each sample is represented in a pie chart, with color indicating the type bacterium I-VI as a percentage of the whole. The date that each sample was taken is also provided on the pie chart. From this panel we can see that each of the Leptospirillum types is represented in the sampling area, but certain genotypes are dominant in certain areas.
To determine the effect of the environment on Leptospirillum, the investigators graphed the flow level of the acid mine drainage against the proportions of organisms living at the C75 location. From the figure, it is clear that L2 early colonizer (II-VI) is generally dominant to all other Leptospirillum strains regardless of the flow rate. The composition of the biofilm fluctuates drastically between Achaea and Leptospirillum dominance but there is not a trend related to the flow rate.
Panel C shows the fluctuation in flow rate of the acid mine drainage over the course of the entire experiment. The grey highlighted area shows the area captured by panel B. This graph shows that the flow rate of the acid mine drainage was not constant over the course of the experiment. The graph does show a consistent ebb and flow of flow rate over the through out the experiment.
Permission Pending
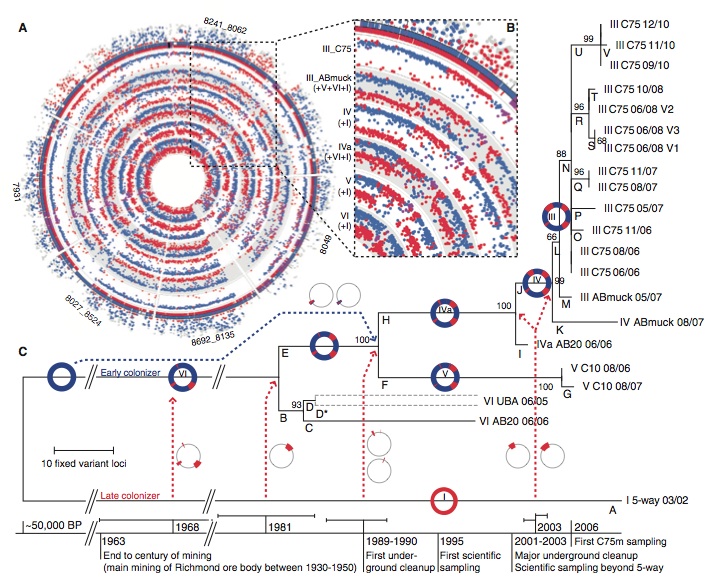
The investigators plotted the unique peptides of each strain found at the C75 location against the reference genomes that were produced by previous experiments on the outer edge of the figure. Interior layers are different genotypes that were found in samples through out the experiment. The different color dots in the interior layers correspond to the unique peptides that are graphed on the exterior of the figure, which shows the origin of each peptide in every genotype can be traced back to either the type I or VI genome.
The enlarged clearly shows that the recombination spots are the same in each genotype. This indicates that homologous recombination events occurred in a single cell, that cell conferred an advantage from the recombination and that genotype proliferated in the population.
The recombination data was used to generate a phylogenetic tree for all genotypes of Leptospirillum that were found. Dotted red lines indicate recombination events and the circles next to the lines indicate which regions of the genome were affected in each event. The one dotted blue line and associated circle indicates a recombination event from an early colonizer as opposed to a late colonizer. As more recombination events occur, we can see the phylogenetic tree becomes more diverse to represent all the different genomes that were found in the sampling. Additionally, the investigators provided a timeline of the history of the mine, showing when traumatic environmental events occurred so that their timing can be compared to the timing of homologous recombination. We can see that several recombination events occurred after drastic changes to the environment, which suggests that the recombination was an advantage under the new environmental conditions.
Permission Pending
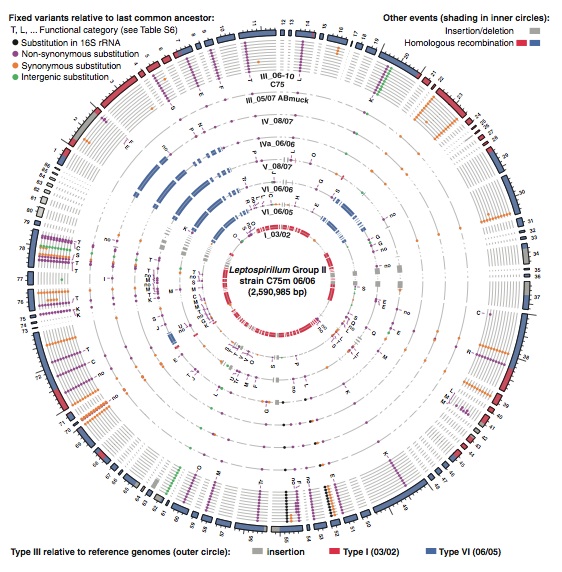
This figure is comparing the original type III genome sequence to all subsequent sequences that the researchers found in their sampling of the mine, with the most recent genome out the outermost ring to the original genome in the innermost ring. This figure clearly shows in which ancestral species particular recombination events occurred in the type III lineage. Additionally insertion and deletion events are shown in a chronological order. The small colored dots indicate when substitutions occurred in the lineage and whether or not they were fixed in the population or lost. This figure gives a very detailed overview of which genes and changes have been incorporated into the type III genome, which shows us how Leptospirillum is evolving to adapt to its changing surroundings. Comparison of this figure to the chronology of the mine in the previous figure can show which changes were results of which environmental factors. This analysis in turn provides evidence for why the hybrid genotypes have proliferated in the mine.
The evolution rate that researchers found was near the higher end of previously predicted evolution rates in other experiments. Using this rate and assuming equal generation times, the investigators calculated that the evolution of the six genotypes occurred between 2 and 44 years.
The investigators found there were a disproportionately high number of global regulators like signal transduction genes and transcriptional regulation genes that were affected by fixed mutations. When the type III Leptospirillum were sampled from different sites along a single flow path, the bacteria from different sites had different variations of the type III genome, implying different SNPs are selected for in different environmental situations within a population. This also indicates that dominance of a particular genotype at a particular spot is not due to lack of diversity but due to natural selection and evolution.
I found the paper to be very well done from the experimental level to the written execution. Observing the bacteria over time in an area with low biodiversity cut down on variables leading to evolution. I would have liked to see an isolated organism, however, I understand that an ecosystem of one would be rare if not non-existent. Additionally, the uneven time frames for sampling seemed strange, but given that the mine was inaccessible at certain times it is not such a problem. Beyond those two complaints, the experiment was very well controlled and executed. The figures were well laid out and, although complex, accessible enough to understand. I did find it annoying that in figure one panel C comes before panel B, which was mildly confusing. I found the conclusions that this paper draws to be reasonable, they did not try to overstep them selves and stated that their results only suggested selection and evolution caused the proliferation of hybrid bacteria. The evidence for homologous recombination in figure two was particularly compelling, showing that peptides were inherited in blocks that originated from either type I or type VI Leptospirillum. The closing paragraph wraps up the results and conclusion of the paper well by restating the conclusion that the evolution rate revealed important divergences. The investigators also made clear the contribution their experiment had to the understanding of the response microbial systems to change. I think this paper was well written, the conclusions were sound, and the knowledge gained from the experiment is helpful and worthwhile.