This webpage was created as part of an undergraduate assignment at Davidson College
The phenotypic legacy of admixture between modern humans and Neandertals
Background:
Simonti et al. published a paper in Science examining the impact of Neandertal (Homo neanderthalensis) DNA found in the modern human (Homo sapiens) genome on human traits (Simonti et al., 2016). This DNA makes up 1.5-4% of the modern Eurasian genome and is present because as modern human groups moved out of Africa and into Europe, they interbred with other ancient hominin populations, including Neantertals. At the time, many of the traits that entered the human gene pool/phenome were probably advantageous as humans adapted to their new climate, but over time these genes have lost their advantage. However, they still are present in the genome, yet no one has provided an in-depth analysis of the impact of these introgressed alleles on modern human phenotypes. Simonti et al. sought to fill this void, and present conclusions to three hypotheses in the aforementioned paper:
1) Is DNA inherited from Neandertals associated with modern human disease?
2) Can current phenotypes be related to specific Neandertal haplotypes?
3) Are electronic health records useful for this type of analysis?
Relevant
terms:
|
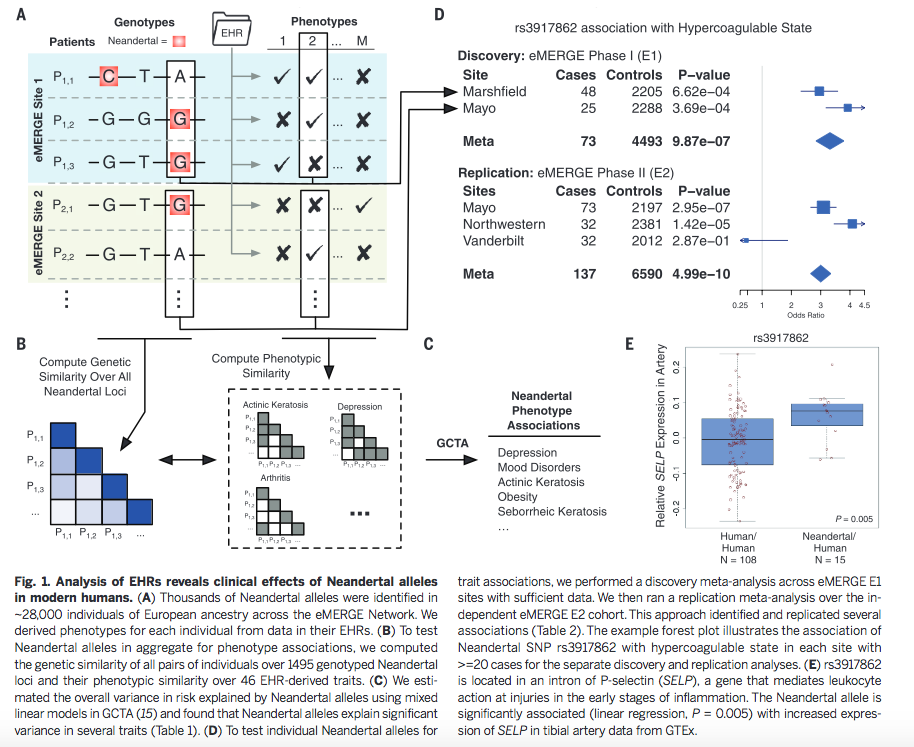
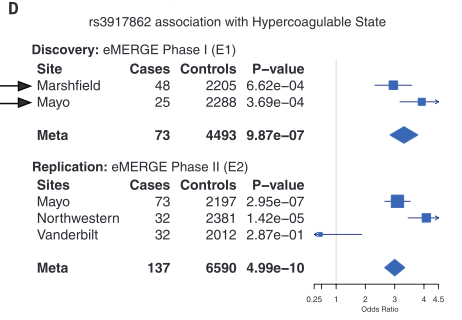
Figure 1 is very busy. It depicts both methods and some sample conclusions of the EHR analysis of genotypic and phenotypic data. It is necessary first to break it down one panel at a time. However, each panel contains information to help the reader understand other panels. There are two critical things to note overall: the method of labeling is consistent throughout panels A, B, and D; and each panel represents only one or a few examples of the kind of analysis that was done for the 1689 considered phenotypes. |
|
Now
that we understand a little more about each panel, we
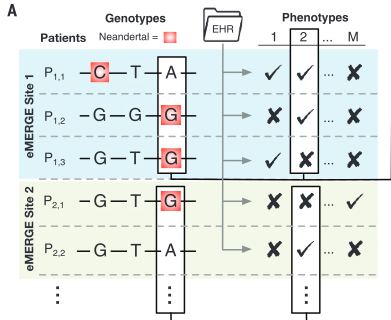
can look at Figure 1 cohesively. First,
genotype and phenotype were matched by aligning genome
sequencing data with phenotypic data from EHRs. Boxes
indicate SNPs associated with phenotype 2. The arrows
connecting panels A and D
show how the blue shaded Site 1 corresponds to samples
from Marshfield, while the green shaded Site 2
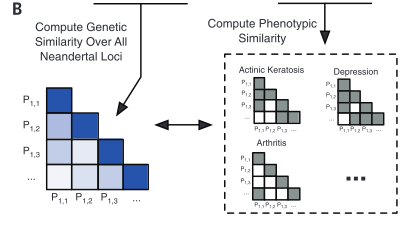
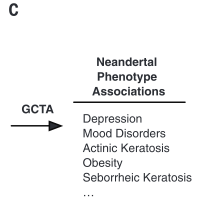
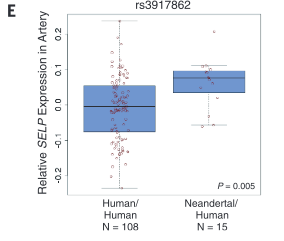
corresponds to samples from Mayo. Panel B demonstrates how similarity of individual genotypes and phenotypes shown in panel A was determined using pair-wise comparisons. From these data, panel C lists some phenotypes associated with Neandertal SNPs, determined via GCTA. The forest plot in panel D demonstrates the association between a Neandertal SNP and an AMH phenotype, in part using data collected in panel A. Finally, panel E is another visual representation of the increased phenotype occurrence from D when the corresponding SNP is present. Overall, this figure displays some methods used throughout the paper and demonstrates the association between Neandertal alleles and AMH phenotypes, as well as relationships between specific SNP-phenotype pairs. |
2) Can current phenotypes be related to specific Neandertal haplotypes?
3) Are electronic health records useful for this type of analysis?
Question
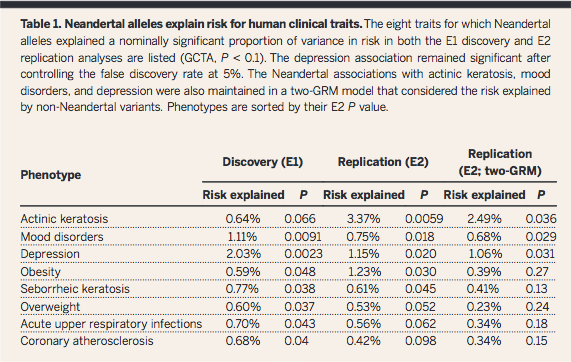
1 was answered in Figure 1 and Table 1, in which the presence of
Neandertal SNPs was overall found to explain multiple AMH
phenotypes (GCTA quantifies influence of SNPs together, not
specific ones). The authors state in the abstract: "Neandertal
alleles together explained a significant fraction of the variation
in risk for depression and skin lesions resulting from sun
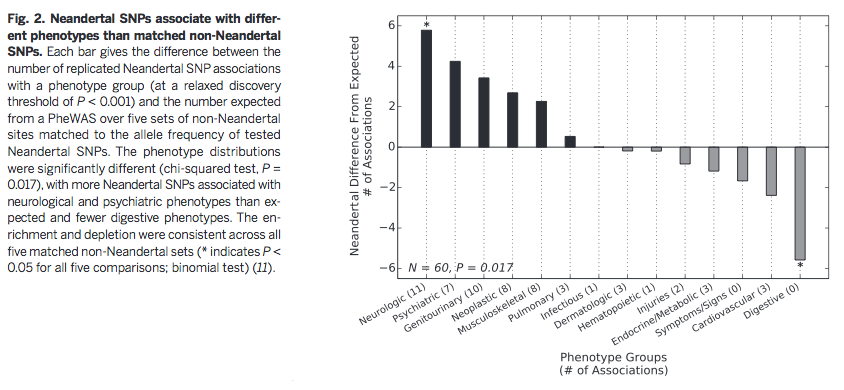
exposure (actinic keratosis)". Based on Figure 2, they also
conclude that certain types of traits are more likely to be
associated with Neandertal DNA, which could be evidence of
environmental selection pressures as AMHs moved out of Africa and
into Europe.
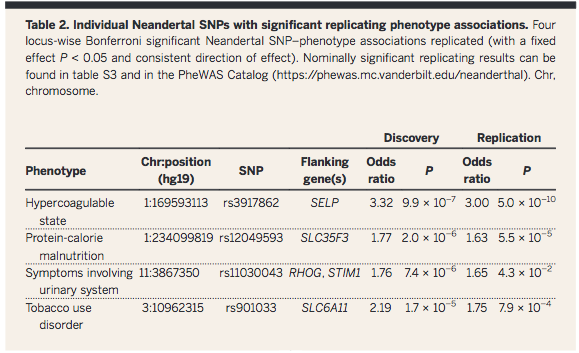
Question
2 was answered in Table 2, in which the influence of Neandertal
DNA on AMH phenotype was pinpointed to a specific chromosomal
position. Again, the abstract summarizes this: "individual
Neandertal alleles were associated with specific human
phenotypes".
Additionally,
Figure 2 suggests that specific types of phenotypes are most
controlled by Neandertal loci. The authors suggest that Neandertal
introgression influenced AMH brain phenotypes, which may have been
advantageous for AMHs as they moved out of Africa into new
climates with different environments and sun exposure. However, in
modern Western environments many of these traits, such as
depression risk, neurologically-based disease, and other
psychiatric phenotypes, are no longer advantageous and are even
detrimental to AMHs.
© Copyright 2016 Department of Biology, Davidson College, Davidson, NC 28035