Data Analysis
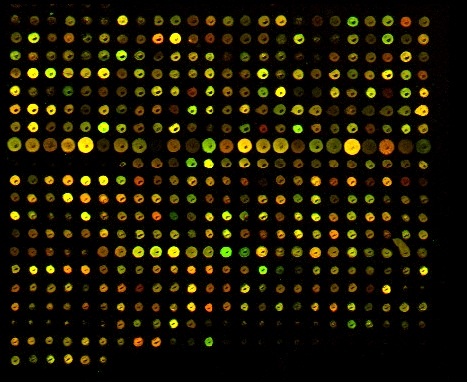
Step 1. Scan Chip.
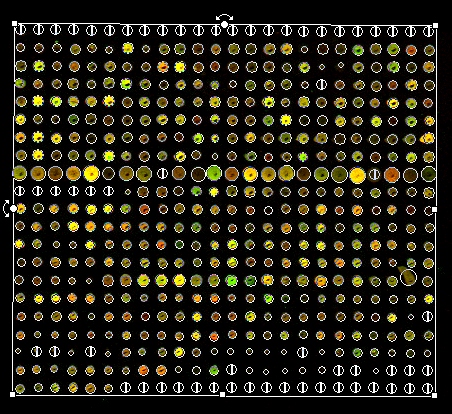
Step 2. Identify Spots.
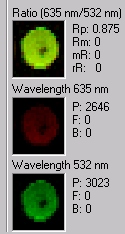
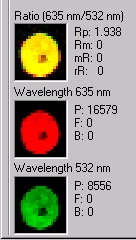
Step 3. Ratio Images for Red and Green Fluorophores
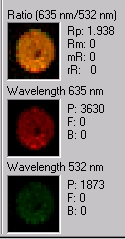
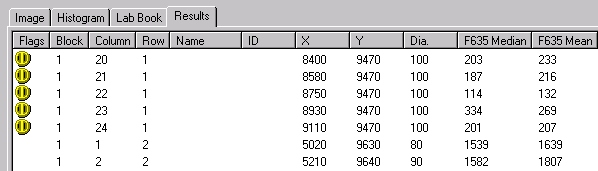
Step 4. Quantify Each Spot.
Step 5. Correlate Colors with Expression
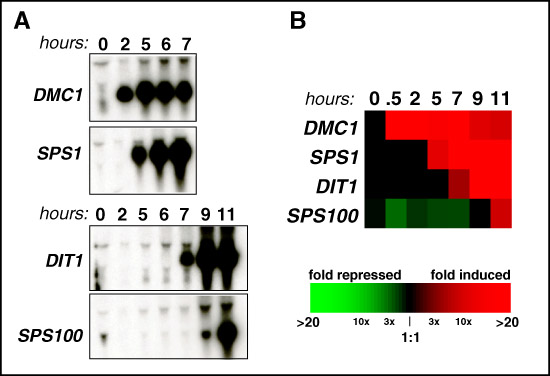
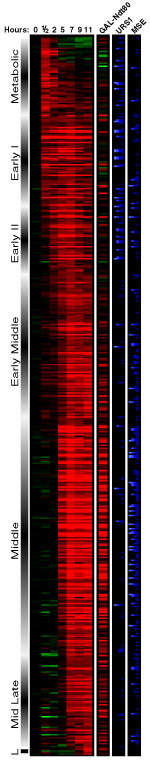
Step 6. Cluster Genes With Similar Profiles
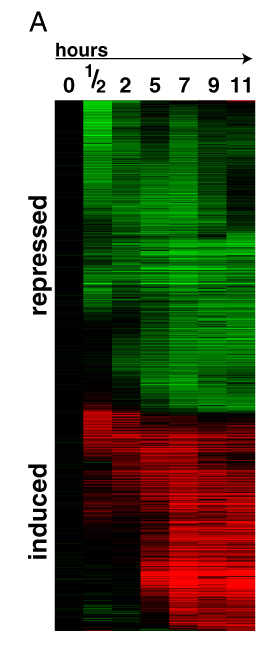
Step 7. Display Genes in Manageable Format