Mac DNAsis Analysis of Human Hexokinase
Mac DNAsis is a computer program that was used to analyze
the DNA sequence of the human cDNA for human hexokinase. In this
analysis MacDNAsis is used to determine the largest open reading frame,
the molecular weight, a hydropathy plot, a antigenicity plot, the secondary
structure, a multiple sequence alignment for five species with hexokinase,
and a phylogenetic tree using five different species with hexokinase.
__________________________________________________________________________________________________________________
Largest Open Reading Frame
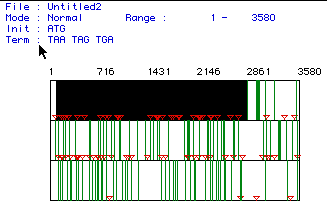
The largest ORF or open reading frame between a start codon and a stop codon of
the human hexokinase cDNA was determined and assumed to be the coding sequence
for the human hexokinase. The coding region extended from nucleotide 82
to 2835. The original human cDNA from which this sequence was derived can
be seen by clicking here.

Fig. 1: This shows three different ORFs (1 on the top and 3 on the
bottom) for the cDNA for human hexokinase. The red triangles represent
start codons and the green lines represent stop codons. The largest
open reading frame is indicated by the black box extending from nucleotide
82 to 2835 for a total of 2753 nucleotides.
________________________________________________________________________________________________________________________
Determination of Molecular Weight
First the DNA of the ORF was translated into the correct amino acid
sequence using the genetic code. The the weight of each amino acid
was added together to obtain the total weight of the protein in daltons.
The weight was 102497.74 daltons.
______________________________________________________________________________________________________________________
Kyte and Doolittle Hydropathy Plot
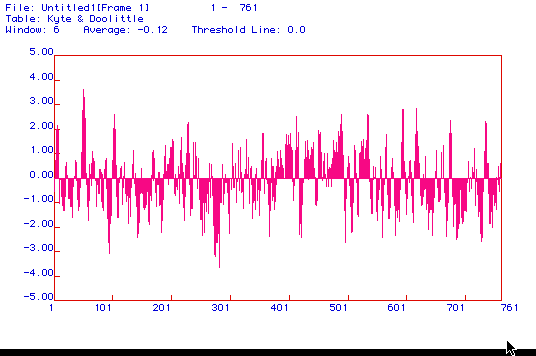
Here MacDNAsis was used to prepare a hydopathy plot of
hexokinase. A hydropathy plot or Kyte and Doolittle Plot shows the
hydrophobicity of a protein along the y axis. The amino acids are
shown by the numbers along the x axis. The Kyte and Doolittle plot
is used to determine whether a protein is a transmembrane protein.
Peaks above 2 indicate strong hydrophobic regions making the protein a
strong candidate for a transmemebrane protein. A transmemebrane protein
must be hydrophobic in some regions in order to be compatible with the
hydrophobic region between the cytoplasmic side and the extracellular side
of a membrane or between the lumen side and the cytoplasmic side
of a membrane.

Fig. 2: Pictured here is a Kyte Doolittle hydropathy plot.
The average is -.12 so the protein is slightly more hydrophilic. There
are however 10 peaks that rise above 2 approximately at the 50th,
110th,
230th,
420th,
480th,
540th, 595th,
610th,670th,
and 740th amino acid. The most hydrophobic
region is the 50th amino acid rising almost to 4.There is a pretty even
stretch of peaks past the 420th amino acid to the end which seems to indicate
a pretty hydrophobic region. All of this data suggests that
this protein is a transmembrane protein.
_______________________________________________________________________________________________________________________
Hopp and Woods Antigenecity Plot
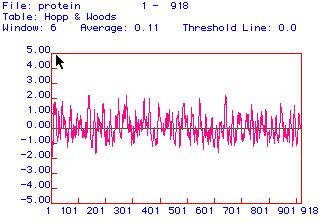
In this section an antigenecity plot was made. These plots show hydrophilicity
instead of hydrophobicity like the Kite and Doolittle plot. A more
hydrophilic region is a better place for an antigen to bind. Thus
an antigency plot helps to determine where on a protein a monoclonal antibody
would bind well. Again the the x axis represents the individual amino
acids but the Y axis represents the hydrophilicity.

Fig. 3: This is a hydrophobicity plot. The protein seems
to have pretty even distributions of hydrophilic and hydrophobic regions
but there are several hydrophilic peaks. There are relatively high
peaks at approximately amino acids 150, 290,
and 650 which are at
about 2. There are and additional few amino acids that come very
close to 2 at approximately 250,
350,
and 550.
These are the most hydrophilic sites which would be best for antigen binding.
_________________________________________________________________________________________________________________________
Prediction of Protein Secondary
Structure
The Chou, Fasman, and Rose plot can be used to
predict the secondary structure of hexokinase. Protein secondary structure
is due to hydrogen bonding with nitrogen and oxygen which are quite electronegative.
These hydrogen bonds are very strong and cause different conformations
with in the protein including alpha helices, beta pleaded sheets, turns,
and coilded regions.

Fig. 4: This figure shows the various location of alpha helices (blue),
beta pleaded sheets (red), turns (green), and coils (balck). This protein
of 918 amino acids seems to have many alapha helicies and beta pleaded sheets
through out the protein with 8 turns and a few coils regions. This image
can be compared to the RasMol image of hexokinase here.
_________________________________________________________________________________________________________________________
Multiple Sequence Alignment
In this multiple sequence alignment the hexokinase protein was compared
in five species for amino acid sequence similarity. The five species
were that were examined were:
Homo
Sapien (previously examined in this MacDNAsis),
Bos
taurus
Yarrowia
lipolytica
Arabidopsis
thaliana
Mus
musculus.
Click on the species to see the DNA and protein sequence from my Genbank
search.

Fig. 5: This is a small portion of the diagram comparing the
entire protein sequences of hexokinases in 5 species. This small
segment compares amino acids 201 to 250. The row marked protein stands
for Homo Sapien. The row marked mus stands for Mus musculus.
The row marked bos taurus stands for Bos taurus. The row marked yarrow
stands for Yarrowia lipolytica. The row marked arab stands for Arabidopsis
thaliana. The highlighted regions indicated amino acids which are
similar in different species. Plain blue letters are amino acids that don't
seem to correlate to other species. Dashes indicate amino acids that
are absent in that particular species but present in another. These
dashes are used in order to best align all the sequences. There seems
to be a great deal of similarity in amino acids in the human, mouse, and
bos taurus species which seems reasonable because all three species are
mammals. The Yarrowia lipolytica and Arabidopsis thaliana (plant)
seem to correlate with the human and other mammals less closely probably
because they are not very closely related to mammals. Between amino
acids 201 and about 240 these two species seem to be lacking many amino
acids that the mammals have. Then between 240 and 250 all five species
seem to have the greatest number of correlating amino acid matches.
______________________________________________________________________________________________________________________
Phylogenetic Tree
This is a representation of the overall conservation of amino acids
in hexokinase for the same five species as used above.
The five species were that were examined were:
Homo
Sapien (previously examined in this MacDNAsis),
Bos
taurus
Yarrowia
lipolytica
Arabidopsis
thaliana
Mus
musculus.
Click on the species to see the DNA and protein sequence from my Genbank
search. This diagram shows the degree of amino acid conservation
over time.

Fig 6: This figure shows a phylogenetic tree for the same five
species compared above and the same abbreviations stand. It looks
as thought the human and the mouse have a very similar hexokinase
proteins with overall compatibility at 89.2%. The bos taurus also
seems to be very similar in amino acid sequence with these two species
at 88.5%. The Yarrowia lipolytica and Arabidopsis thaliana (plant)
are not largely similar at 20% and overall compatibility of all five species
is 14.5% . It seems logical that all of the mammals would have
highly conserved sequences since they are all evolved from a similar ancestor.
The Yarrowia lipolytica and Arabidopsis thaliana (plant) on the other hand
show little amino acid sequence conservation amongst themselves and amonst
the other species because they are probably related by a more distant ancestor.
_________________________________________________________________________________________________________________________
Click to return to my Main
Page
Click here to return to the Molecular
Biology Home Page
Send comments, questions, and suggestions to:
Sabrautigam@davidson.edu


