This web page was produced as an assignment for an undergraduate course at Davidson College.
My Favorite Yeast Expressions: SKI6 and YGR201C?
"Thousands of genes are being discovered for the first time by sequencing the genomes of model organisms, an exhilarating reminder that much of the natural world remains to be explored at the molecular level. DNA microarrays provide a natural vehicle for this exploration. The model organisms are the first for which comprehensive genome-wide surveys of gene expression patterns or function are possible. The results can be viewed as maps that reflect the order and logic of the genetic program, rather than the physical order of genes on chromosomes. Exploration of the genome using DNA microarrays and other genome-scale technologies should narrow the gap in our knowledge of gene function and molecular biology between the currently-favoured model organisms and other species." (Brown and Botstein, 1999)
Introduction and Purpose
This web page uses public DNA microarray databases to analyze the expression of SKI6 and YGR201C. My annotated gene, SKI6, plays a role in the 3'-5' degradation of mRNA. YGR201C is a gene that currently has an unknown biological process, molecular function, and cellular component. Through the use of microarray expression information I hope to discover and explain the cellular roles of these two genes. Please note that on my favorite yeast genes page I analyzed a dubious ORF that is not necessarily a gene. Therefore, I am using a new non-annotated gene for this assignment.
|
| Figure 1. The genes I chose are located on chromosome VII of the S288C strain of Saccharomyces cerevisiae genome, coordinates 890000 - 920000. SKI6 (also known as ECM20, RRP41 and systematically YGR195) has been well characterized and documented. Conversely, specific information regarding the role of YGR201C is unknown. SGD Chromosomal Features Map. |
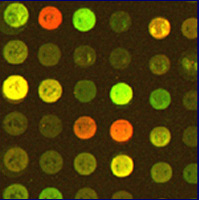
Microarrays (or chips) are glass slides with a spot of DNA corresponding to every gene in an organism's genome. Next, the investigator selects a cell type to grow under various experimental conditions. mRNA is isolated from these populations and converted to cDNA (labeled red and green with fluorescent probes), which is hybridized with the microarray. After excess cDNA is washed away, a scanner is used to detect the fluorescent color of bound cDNA and produce an image. Next, the light intensity of each spot is analyzed to obtain a numerical ratio. This number is for each gene indicated by a red green color scale (see figure below). Fold repression means that the green condition is more highly expressed and fold induction means that the red condition is produced more often.
 |
 |
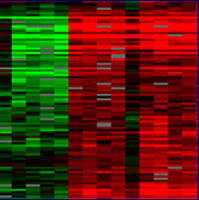 |
| Figure 2. The image on the right shows spots on a chip that has been scanned. A spot appears red for one condition, green for the other, yellow when the gene is expressed under both, and black when it is not expressed under either experimental condition. The image on the right is a gene expression profile that has been processed and transposed onto a color scale indicating the ratio of induced (red) to repressed (green) genes. Black spots indicate a 1:1 expression ratio of red and green. Each column represents a condition while each row represents a gene. Images courtesy of Derisi Labs. | ||
DNA microarrays are changing molecular biology at a phenomenal rate. The amount of data currently available to the public will take years to analyze and understand completely. Over five years ago, in one of the first microarray papers, Patrick Brown of Stanford had the insight to realize that:
"It is now readily feasible to use DNA microarrays to survey and analyse patterns of gene expression directly in pathogens and human cells... Not only will the clusters of co-expressed genes identified in those surveys frequently include orthologues of genes characterized in other systems, but the patterns of expression will often suffice to begin de novo discovery of potential gene functions: one set of genes will be associated with stress response; another set with responsiveness to a hormone, yet another set will be associated with neoplasia. Overlaps and connections among these patterns will provide further insights, and very rapidly the process of discovery via gene expression pattern will lead to the generation of hypotheses that can be tested in the non-model organism directly. We are persuaded that the ability to observe the behaviour of many genes at a time is the main immediate benefit of genome sequencing. Indeed, we believe that ability to study, in ordinary laboratories, thousands of genes simultaneously using genomescale methods such as microarray hybridization will be the hallmark of post-genome biological research" (Brown and Botstein, 1999).
The following resources are invaluable when searching for DNA microarray information.
If you would like more information about microarray techniques, these sites provide excellent introductory details. |
If you would like to mine current microarray data to explore the expression patterns of genes try these sites. |
| Microarray Technology Overview | Expression Connection |
| Technique by Dr. Campbell (Flash and Non-flash) | Function Junction |
| Technique by Dr. Buhler at Washington University | Webminer |
| Microarray Glossary thoroughly defining relevant terms | SGD |
| Links to sites relevant to microarray technology | Public Microarray Database |
| Science Article about Microarrays | DeRisi Lab Software and Protocols |
| Dr. Campbell's FAQ Page | Gene Expression Omnibus |
SKI6 Annotated Gene
Expression Connection Data Analysis for SKI6
Though the functions of SKI6 have been investigated and reported, it is helpful to look at expression profiles for this gene under various experimental conditions. These data can be used to understand how microarray results are interpreted.
By searching Expression Connection I can determine how SKI6's expression pattern changes under various experimental conditions. After querying all 16 data sets, I noticed that SKI6 is not consistently induced or repressed to an extreme level under any of the experimental conditions listed. I believe this is because my gene is important to yeast, as evidenced by the fact that mutations are not viable. If this gene had high levels of induction and repression under many experimental conditions, the gene's function would be compromised. Just to be sure, I used the second search option to clearly determine when SKI6 was induced or repressed at least two fold.
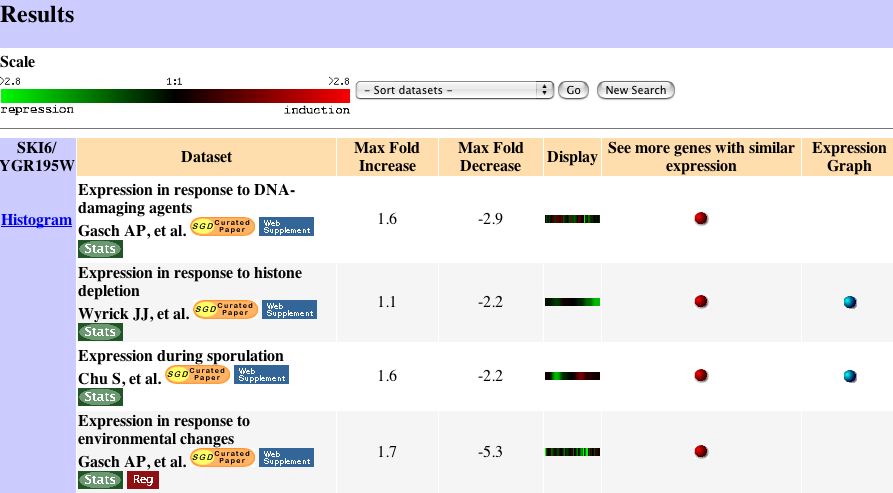 |
| Figure 3. These are the microarray results that showed the strongest induction or repression of SKI6. Expression Connection |
 |
| Figure 4. The search II option at Expression Connection resulted in four data sets with high repression levels. "This histogram shows how many experiments SKI6/YGR195W mRNA expression changed by 2 fold, 4 fold, etc. A negative number means expression is repressed. A positive number means expression is induced." Expression Connection. |
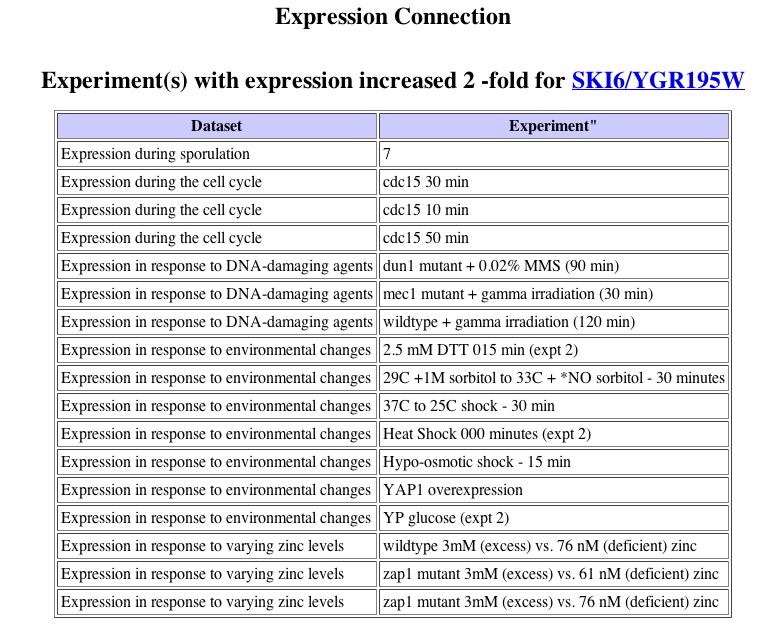 |
| Figure 5. Although the search II results page does not show any genes to be induced greater than 2 fold (possible database error), the histogram has a bar representing almost 20 conditions where SKI6 is highly induced. Expression Connection. |
 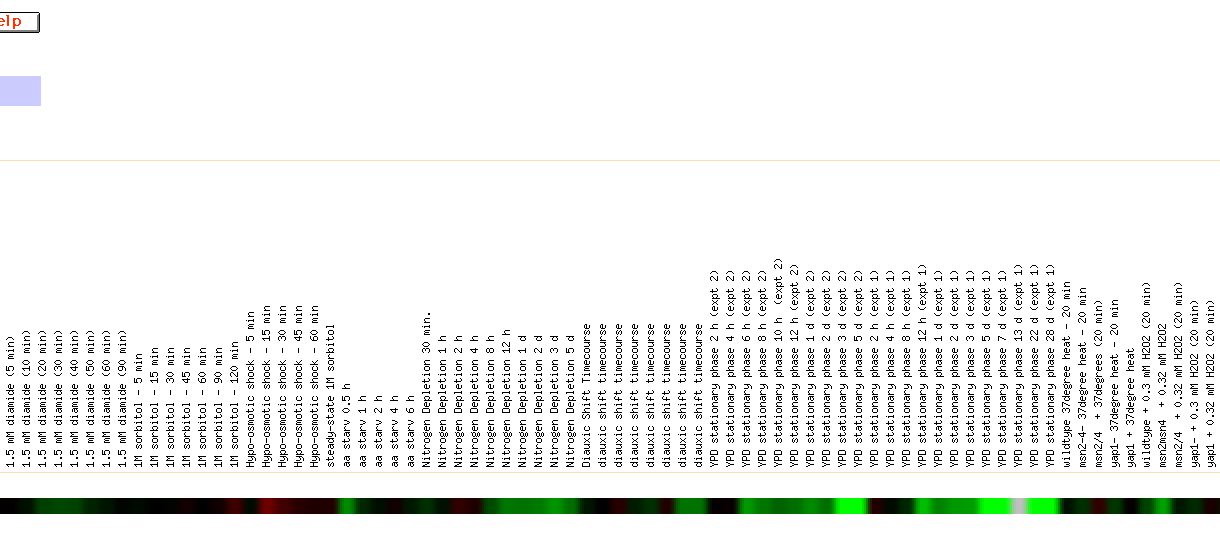  |
The authors note that, "The genomic response to heat shock was strikingly similar to that triggered by stationary phase, including the induction of genes involved in respiration and alternative carbon source utilization. Because extracellular glucose concentrations did not change during the course of the heat shock experiment (data not shown), we propose that chaperone-dependent protein folding in the immediate aftermath of heat shock causes a sudden decrease in cellular ATP concentrations. A shift in the ATP:AMP ratio might then lead to the observed expression alterations in central energy metabolism genes, similar to the response seen in mammalian cells" (Gasche et al., 2000). However, my gene has no known function in respiration so I am unsure of the significance of this correlation. As cells responded to progression into the stationary phase there was a gradual progression of repression, which became particularly high for SKI6 after 5 days.
Two datasets with high repression of SKI6:
 |
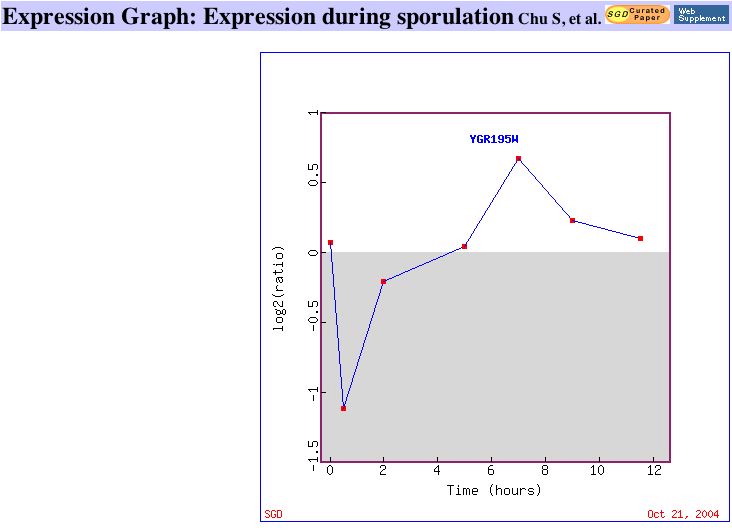 |
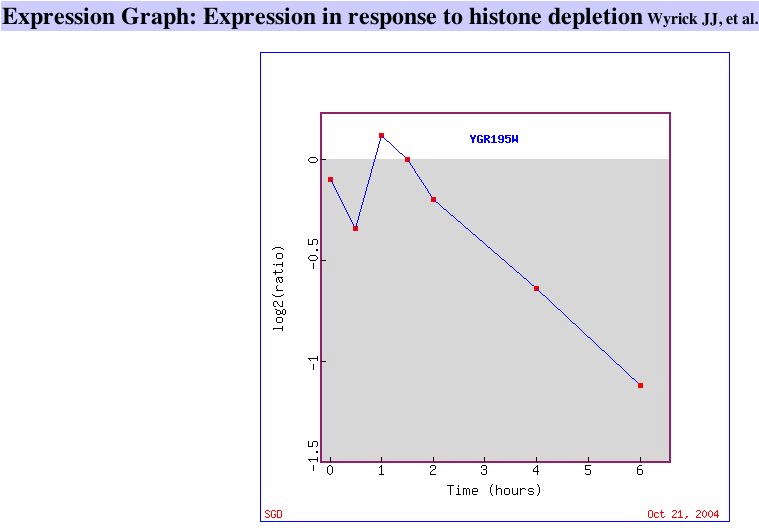
| Figure 7. This graph shows that SKI6 is gradually repressed as histone is depleted in yeast cells. Similar Genes. | This graph shows SKI6 being repressed during early population and later being induced. Similar Genes. |
In this section, I compare expression profiles of genes that are induced and repressed similarly when exposed to certain environmental conditions. All of these data come from Expression Connection.
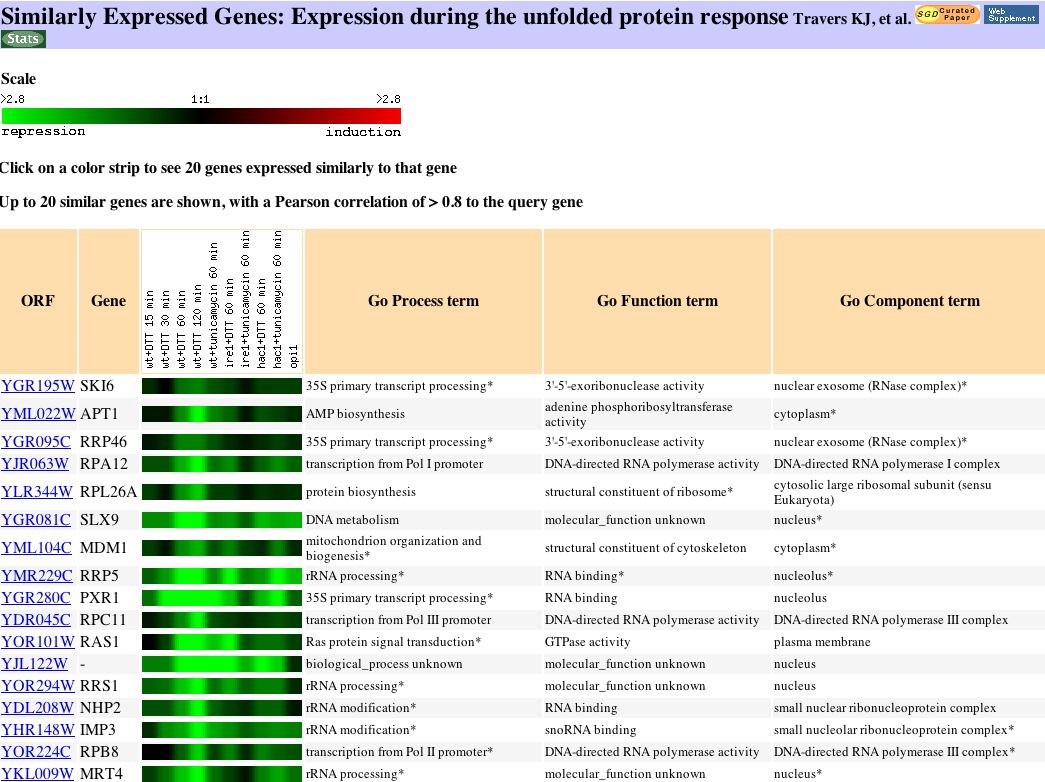 |
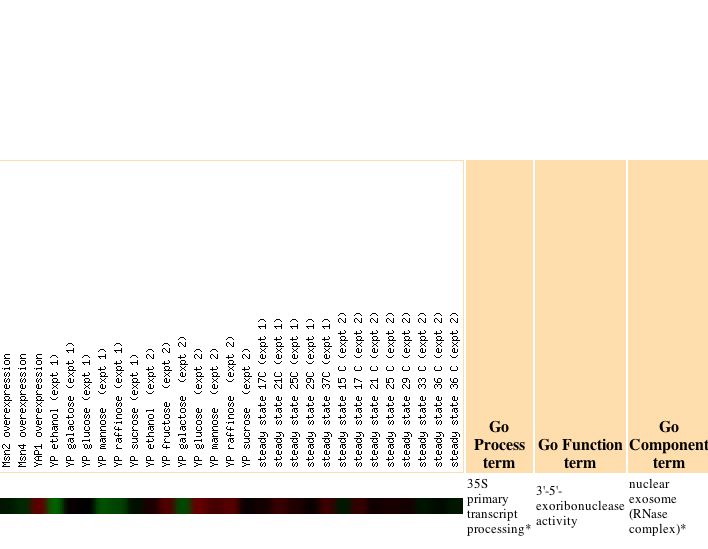
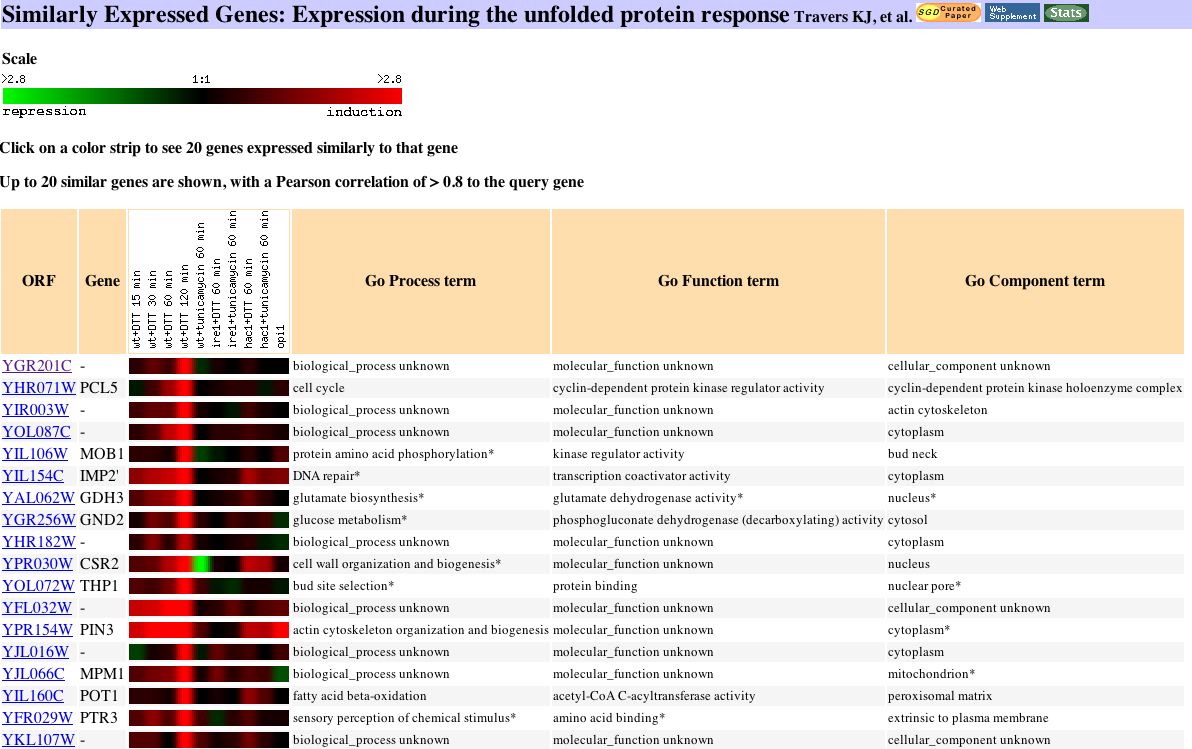
| Figure 8. This expression profile shows many genes with similar functions, such as RNA processing and modification in the nucleus are repressed under these conditions. "The unfolded protein response (UPR) regulates gene expression in response to stress in the endoplasmic reticulum (ER)... The UPR and ER-Associated Protein Degradation are dynamic responses required for the coordinated disposal of misfolded proteins even in the absence of acute stress" (Travers, et al., 2000). |
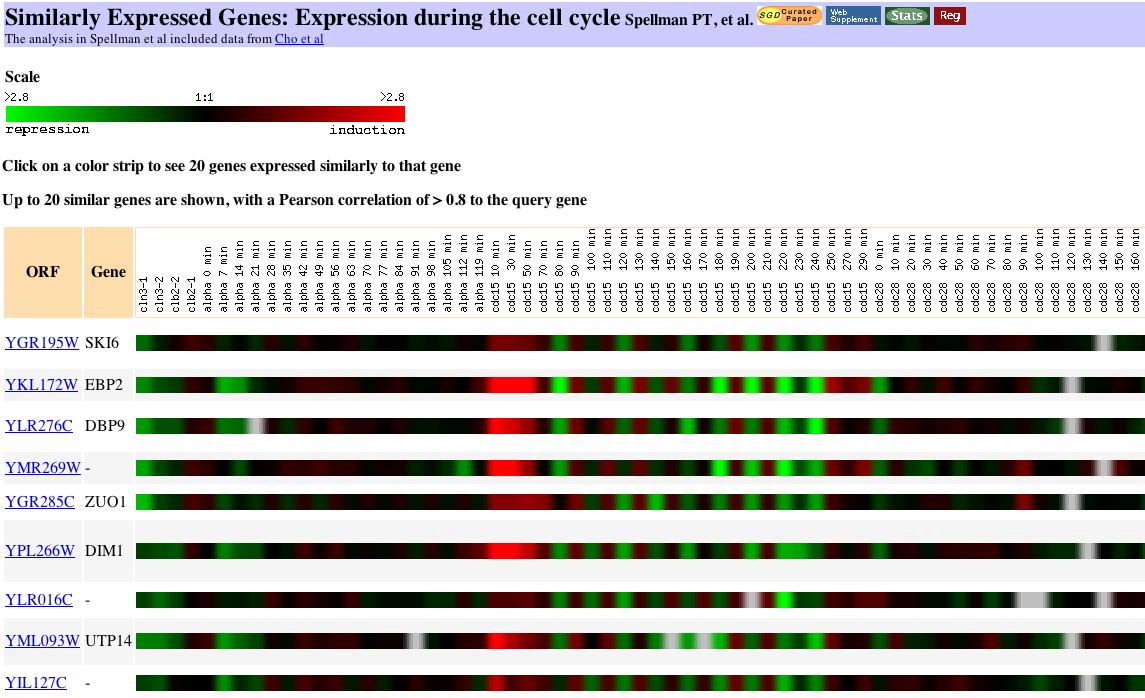 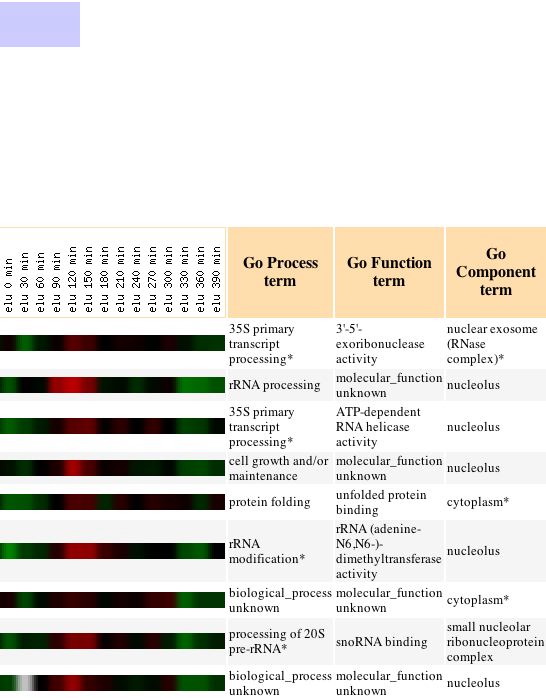 |
| Figure 9. You can see individual cycles of the cell in the cdc15 portion of this figure. The cell cycle experiment, completed at Stanford, measured the relative expression of yeast genes at various points in the life of the cell. The investigators "used DNA microarrays and samples from yeast cultures synchronized by three independent methods: factor arrest, elutriation, and arrest of a cdc15 temperature-sensitive mutant." Investigators chose reference genes representative of each of the phases of the cell cycle: G1, S, G2 and mitosis. (Spellman et al., 1998). My gene is similar to genes responsible for ribosomal RNA processing and biogenesis. |
 |
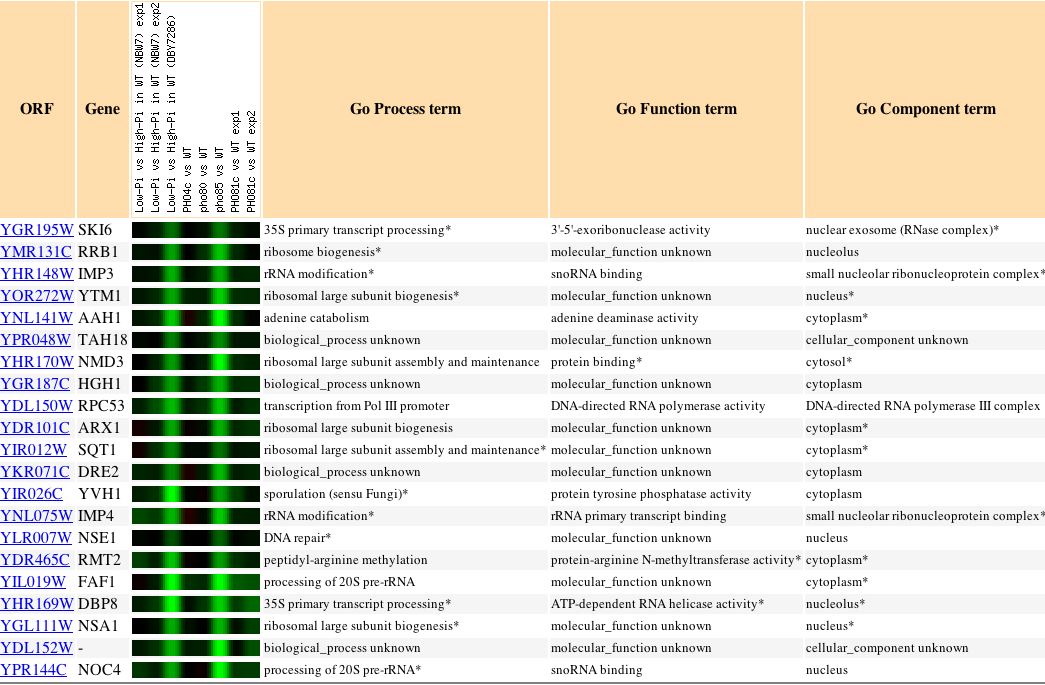 |
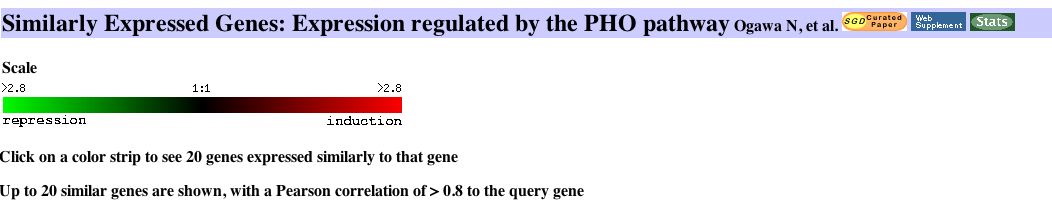
Figure 10. In this experiment it is evident that SKI6 is expressed in patterns similar to genes responsible for ribosomal biogenesis and assembly. This is a brief explanation of the PHO pathway, "involved in the acquisition of phosphate (Pi) in the yeast Saccharomyces cerevisiae. When extracellular Pi concentrations are low, several genes are transcriptionally induced by this pathway, which includes the Pho4 transcriptional activator, the Pho80-Pho85 cyclin-CDK pair, and the Pho81 CDK inhibitor" (Ogawa, 2000). |
Function Junction Data Analysis for SKI6
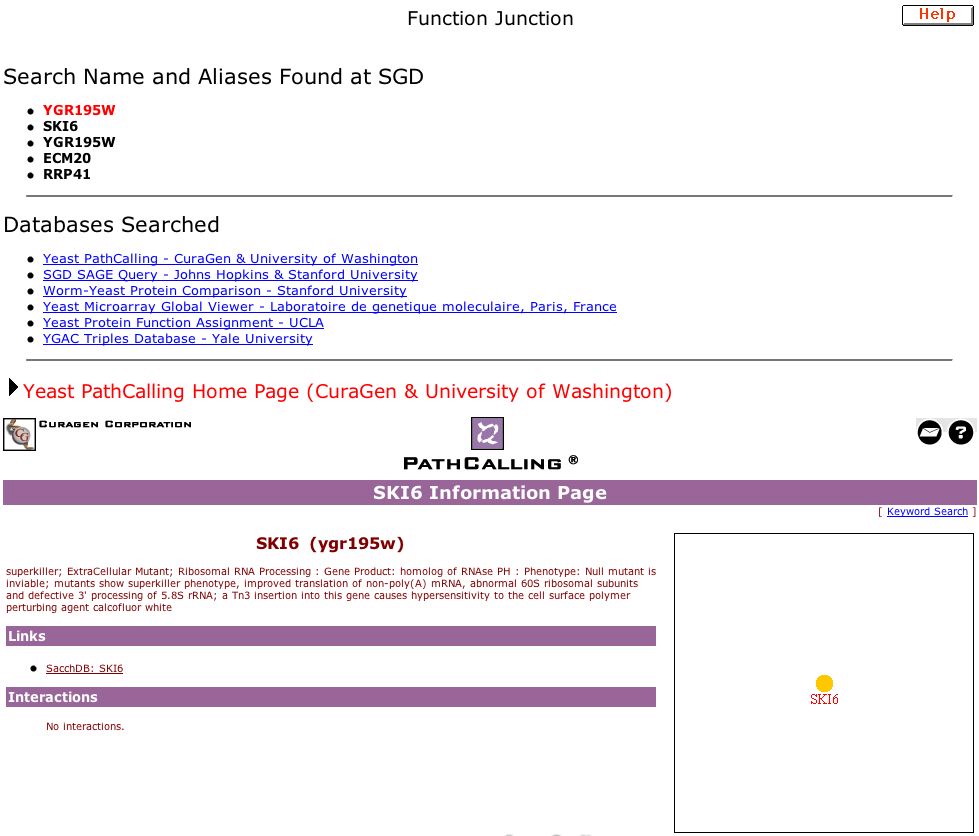 |
| Figure 11. This is the site containing data for my annotated gene: Function Junction for YGR195W. A condensed version of the cellular role of SKI6 is provided along with a map showing that how this gene interacts with others is still unknown. |
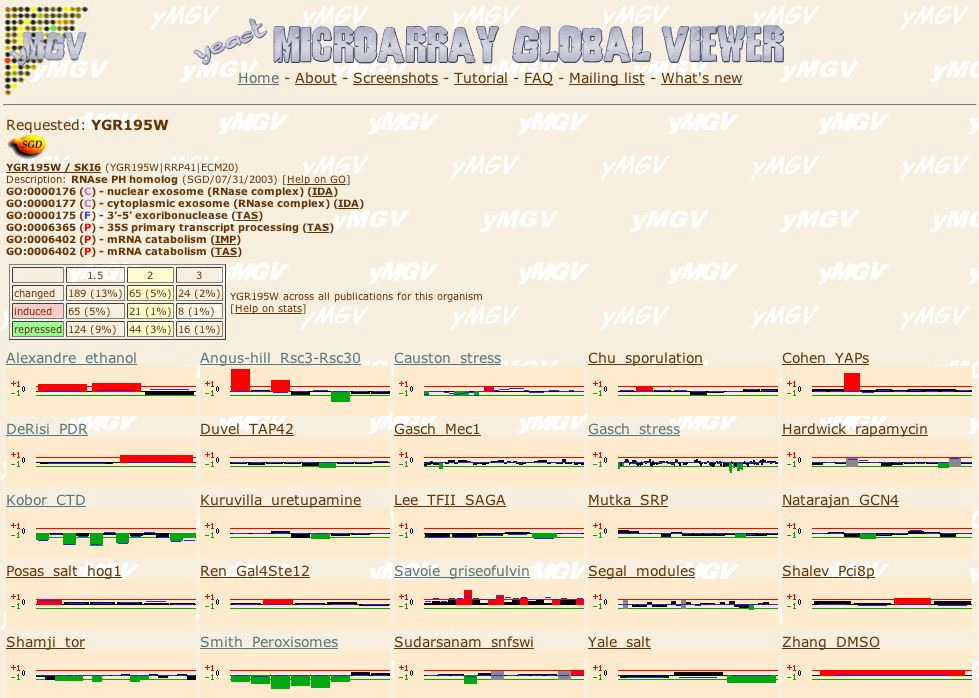 |
| Figure 12. At the Microarray Global Viewer site I searched for experimental conditions where SKI6 is induced or repressed at least 2 fold. The results show 20 expression profiles of interest. |
Conclusion: The data available at expression connection confirms the role of SKI6 and provides a wealth of information about genes that could be similar under the guilt by association theory. SKI6 is vitally important for yeast due to the role it plays in RNA processing and ribosome activity.
YGR201C Non-Annotated Gene
Expression Connection Data Analysis for YGR201C
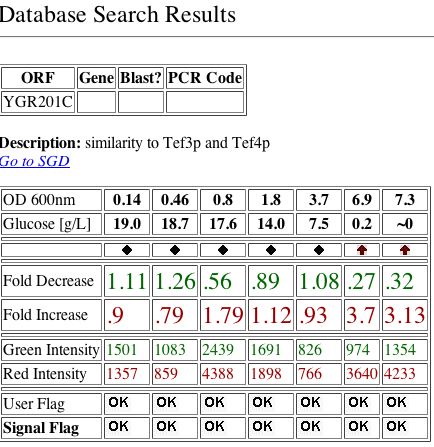
My gene with unknown cellular function has higher levels of microarray condition expression than SKI6. This is the Expression Connection page for YGR201C.
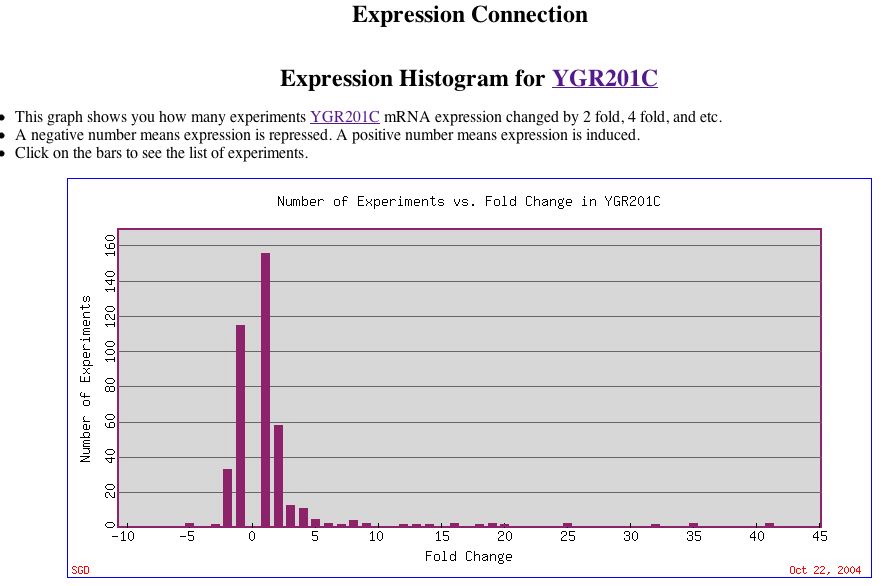 |
| Figure 13. This histogram provides an overview of the levels of YGR201C expression. Note the high induction levels for some experimental conditions. The very strongly induced bars represent the long YPD stationary phases mentioned earlier. |
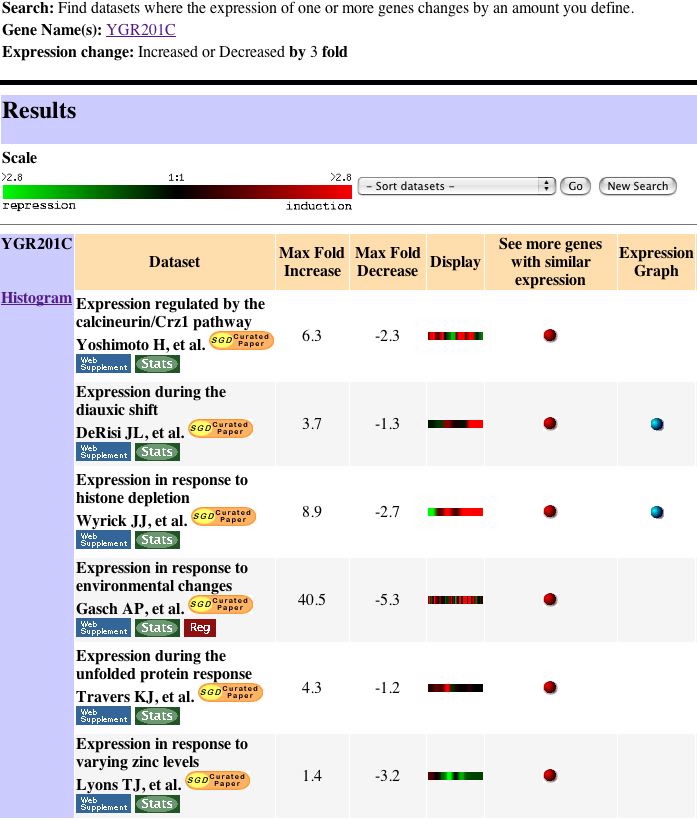 |
| Figure 14. This figure shows the Search II results. Each of these six bars has a meaningful expression pattern that will provide information through the guilt by association theory. |
 |
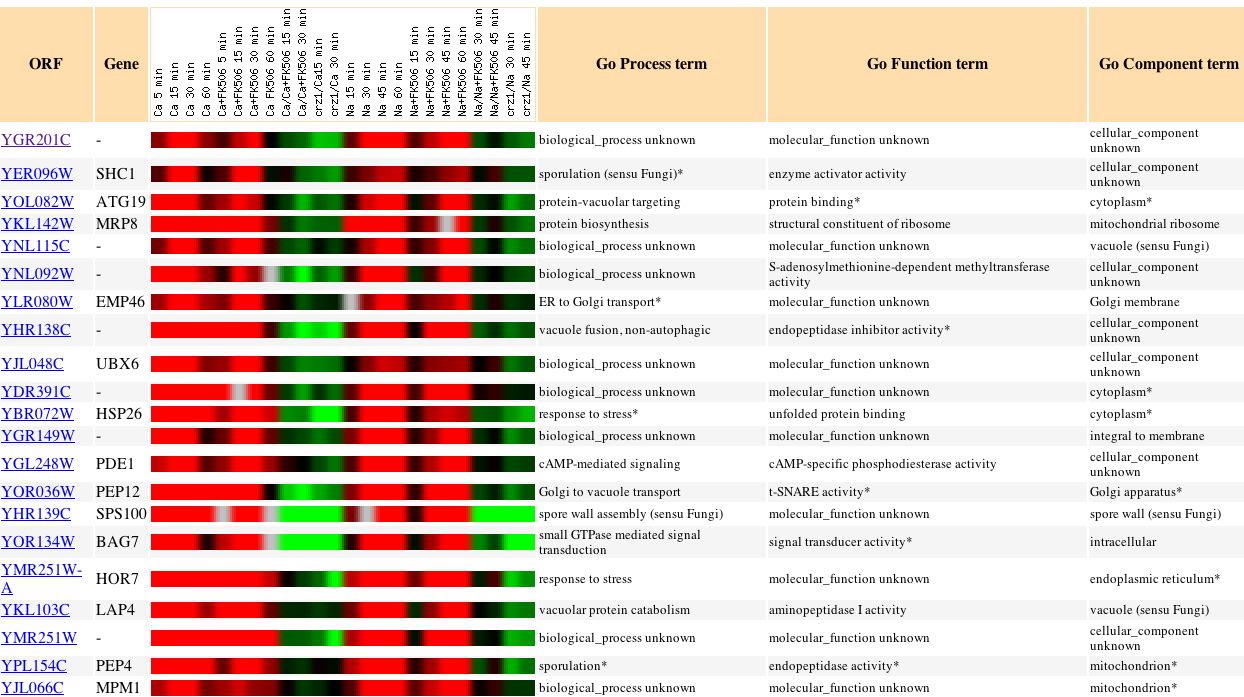 |
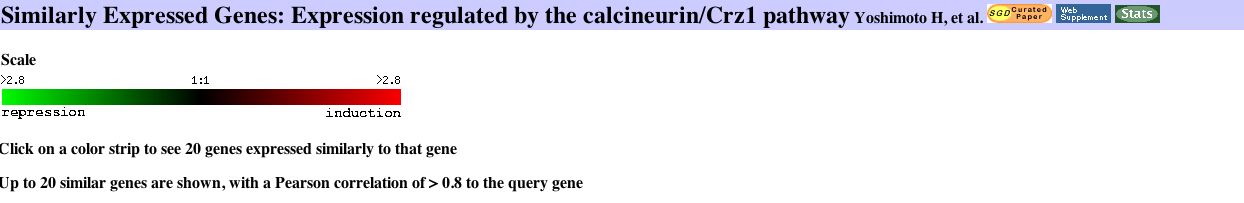
Figure 15. "In Saccharomyces cerevisiae, the Ca(2+)/calmodulin-dependent protein phosphatase, calcineurin, is activated by specific environmental conditions, including exposure to Ca(2+) and Na(+), and induces gene expression by regulating the Crz1p/Tcn1p transcription factor. We used DNA microarrays to perform a comprehensive analysis of calcineurin/Crz1p-dependent gene expression following addition of Ca(2+) (200 mm) or Na(+) (0.8 m) to yeast. These calcineurin-dependent genes function in signaling pathways, ion/small molecule transport, cell wall maintenance, and vesicular transport, and include many open reading frames of previously unknown function." My gene has calcineurin-dependent induction, as indicated by the alternating red and green pattern produced in the presence of Na or Ca. Potentially, YGR201C is involved in signaling or transport (Yoshimoto, 2002). |
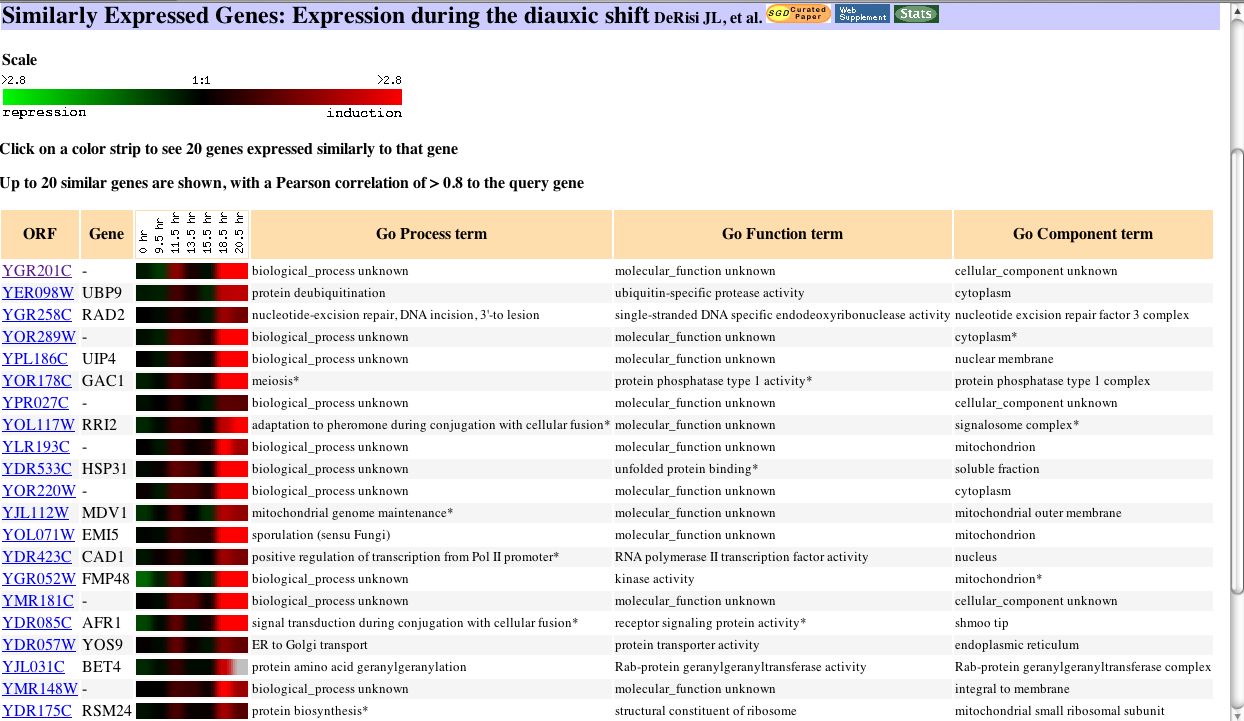 |
| Figure 16. The diauxic shift is the change from anaerobic(fermentation) to aerobic respiration. It is logical that genes are induced to compensate as the shift proceeds. |
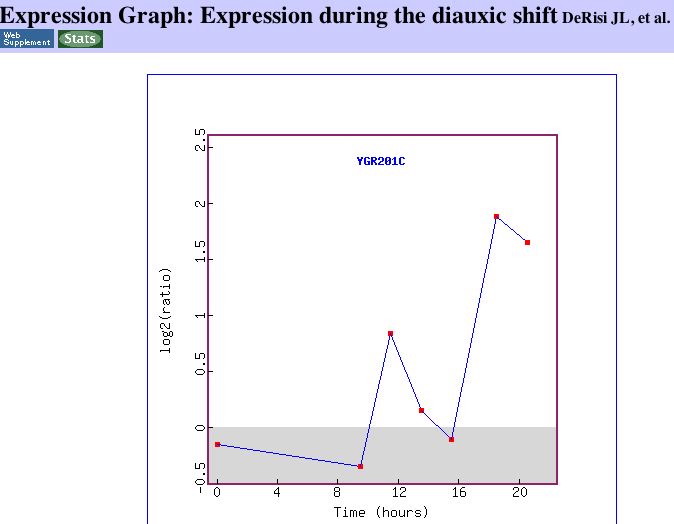 |
 |
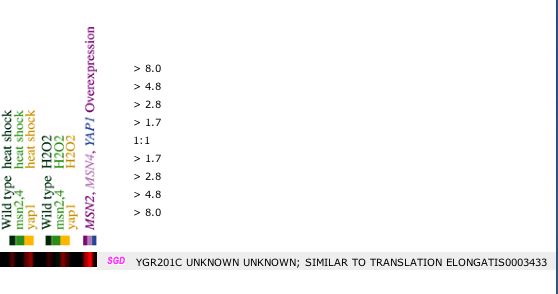
| Figure 17. The expression graph clearly shows the induction of YGR201C as aerobic respiration begins. I could not find any information about the peak around 12 hours. | Figure 18. This image from DeRisi's work shows that YGR201C is similar to genes that function in translation elongation. http://cmgm.stanford.edu/pbrown/explore/ |
 |
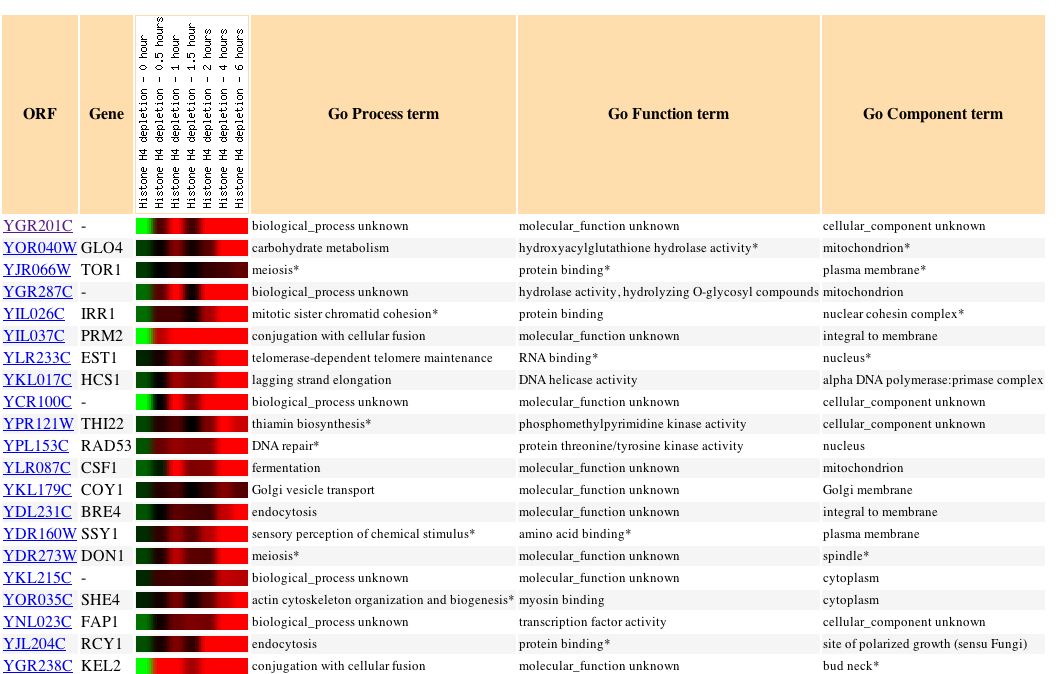 |
| Figure 19. This paper examined "the effects of depleting nucleosomal histones and silencing factors in yeast. Reducing nucleosome content by depleting histone H4 caused increased expression of 15% of genes and reduced expression of 10% of genes." My gene was induced nearly 10 fold as histones were depleted. It appears that my gene has an expression profile quite similar to genes that are involved in cellular fission. (Wyrick, 1999) |
 |
| Figure 20. The guilt by association theory suggests that my gene my be involved in metabolism of some sort and have a function related to regulation. (Travers, 2000) |
 |
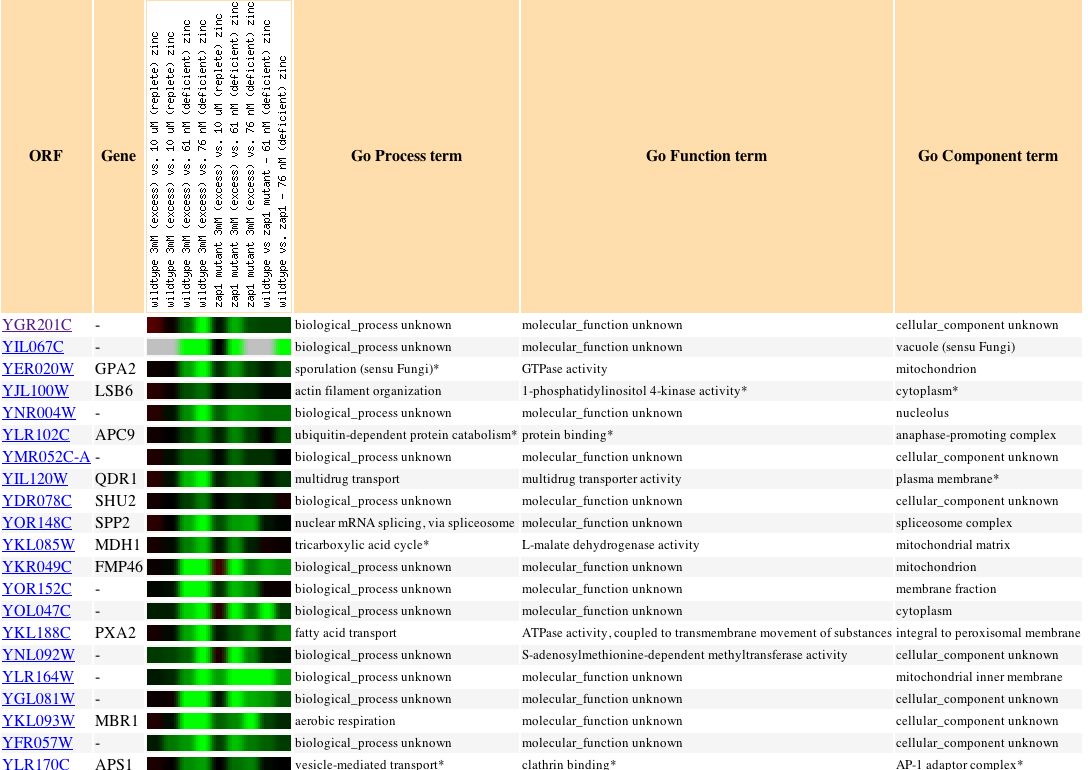 |
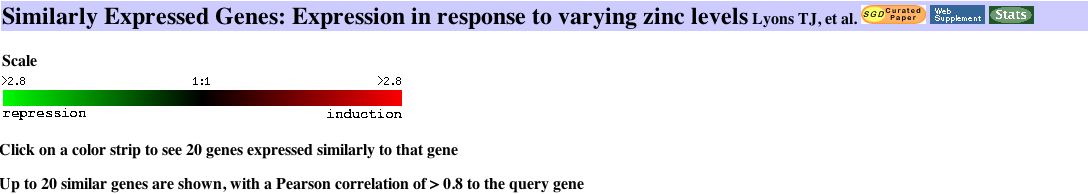
| Figure 21. Though my gene is repressed when zinc levels change, no other genes with a known function, process, or component have a similar profile. |
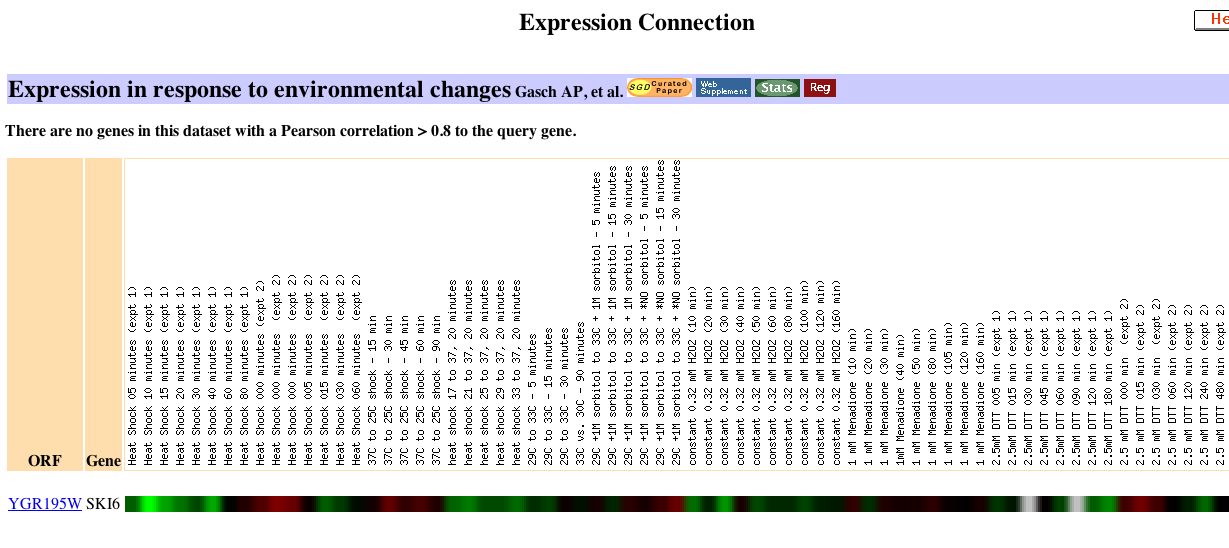
Please click here to see the very large set of similar expression patterns in response to environmental changes. Expression Connection.
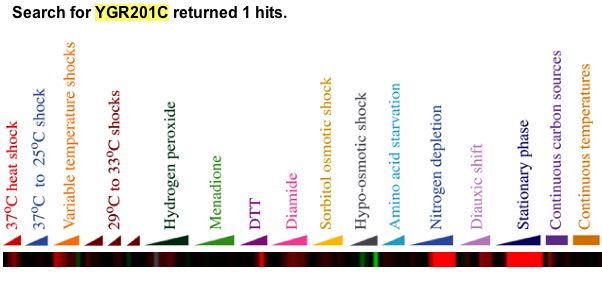  |
| Figure 22. This figure is from a online supplement to the original paper. YGR201C was induced when placed in environmental conditions such as heat shock in excess of 20 minutes, diamide presence, nitrogen depletion, and YPD stationary phase. Gasch writes, "Approximately 300 genes, of which nearly 60% are completely uncharacterized, were induced in the ESR (see web supplement for details). The functional themes represented by these genes are likely to provide many clues to the ways cells fortify themselves for survival in inhospitable environments. The genes in this group with known molecular functions are involved in a wide variety of processes, including carbohydrate metabolism, detoxification of reactive oxygen species, cellular redox reactions, cell wall modification, protein folding and degradation, DNA damage repair, fatty acid metabolism, metabolite transport, vacuolar and mitochondrial functions, autophagy, and intracellular signaling. Many of the genes induced in the ESR have previously been proposed to offer cellular protection during stressful conditions, such as oxidative stress, heat shock, osmotic shock, and starvation" (Gasch, 2000). |
Function Junction Data Analysis for YGR201C
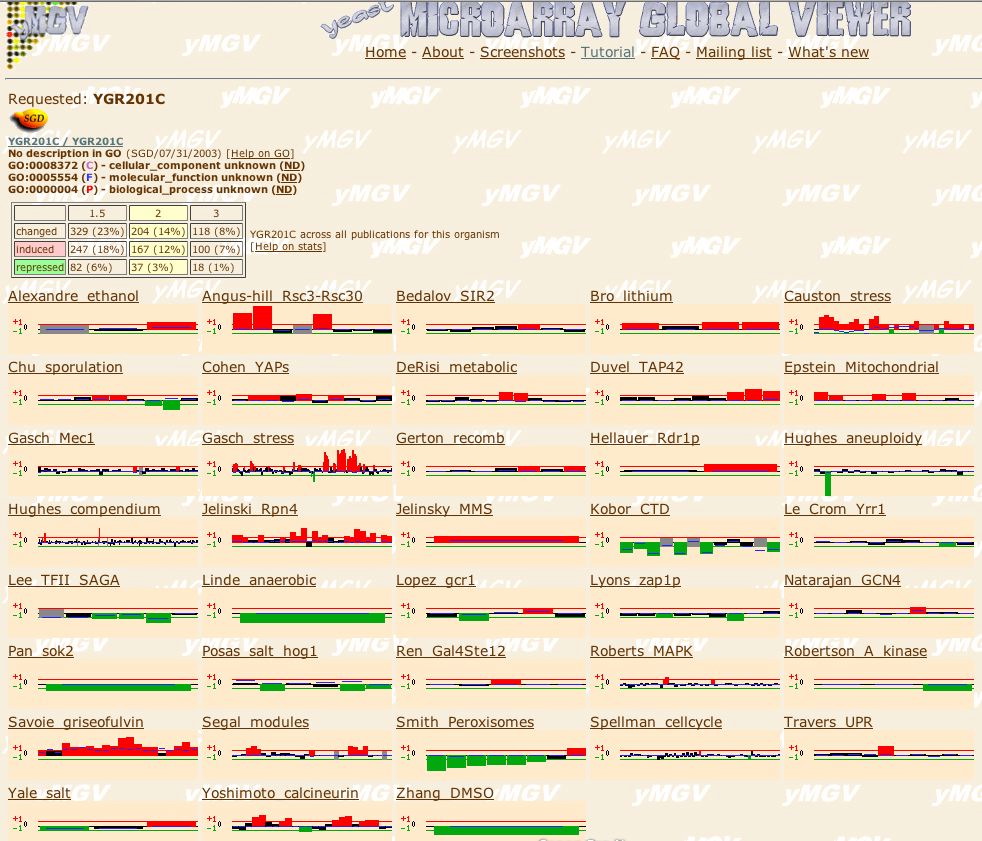 |
| Figure 23. At the Microarray Global Viewer site I searched for experimental conditions where SKI6 is induced or repressed. |
Conclusion: I believe that YGR201C plays an important role in metabolism, stress response, or protein binding. Guilt by association theory seems to favor the cytoplasm as the GO Cellular Component. YGR201C is expressed strongly and frequently as the MGV figure above indicates. The majority of the genes similar to YGR201C have functions that are yet to be determined. As more genes are annotated, these tools will become increasingly powerful indicators of a gene's cellular roles.
Links and References
http://www.gene-chips.com/
http://transcriptome.ens.fr/ymgv/
http://bio.davidson.edu/projects/GCAT/FAQ.html
http://www.molbiolcell.org/cgi/content/full/11/12/4241
http://www.deathstarinc.com/science/biology/chips.html
http://www.cs.wustl.edu/~jbuhler//research/array/#image
http://www.genomicglossaries.com/content/microarrays.asp
http://bio.davidson.edu/courses/genomics/chip/chip.html
http://www.sciencemag.org/feature/e-market/benchtop/micro.shl
http://bio.davidson.edu/people/macampbell/strategies/chipsintro.html
http://db.yeastgenome.org/cgi-bin/ORFMAP/ORFmap?chr=7&beg=880000&end=920000
http://db.yeastgenome.org/cgi-bin/expression/expressionConnection.pl?query=YGR195W&noSearch=1
http://db.yeastgenome.org/cgi-bin/expression/expressionConnection.pl?orf=YGR195W&dataset=histone&type=similar
http://db.yeastgenome.org/cgi-bin/expression/expressionConnection.pl?orf=YGR195W&dataset=stressResponse&type=similar
Brown PO, Botstein D. (1999). Exploring the new world of the genome with DNA microarrays. Nat Genet. 1999 Jan;21(1 Suppl):33-7.
Gasch AP, Spellman PT, Kao CM, Carmel-Harel O, Eisen MB, Storz G, Botstein D, Brown PO (2000) Genomic expression programs in the response of yeast cells to environmental changes. Mol Biol Cell 11(12):4241-57 LINK
Ogawa N, DeRisi J, Brown PO (2000) New components of a system for phosphate accumulation and polyphosphate metabolism in Saccharomyces cerevisiae revealed by genomic expression analysis. Mol Biol Cell 11(12):4309-21 LINK
Travers KJ, Patil CK, Wodicka L, Lockhart DJ, Weissman JS, Walter P (2000) Functional and genomic analyses reveal an essential coordination between the unfolded protein response and ER-associated degradation. Cell 101(3):249-58 LINK
Wyrick JJ, Holstege FC, Jennings EG, Causton HC, Shore D, Grunstein M, Lander ES, Young RA (1999) Chromosomal landscape of nucleosome-dependent gene expression and silencing in yeast. Nature 402(6760):418-21 LINK
Yoshimoto H, Saltsman K, Gasch AP, Li HX, Ogawa N, Botstein D, Brown PO, Cyert MS (2002) Genome-wide analysis of gene expression regulated by the calcineurin/Crz1p signaling pathway in Saccharomyces cerevisiae. J Biol Chem 277(34):31079-88 LINK
Questions or Comments? Email: shbossie@davidson.edu
© Copyright 2004 Department of Biology, Davidson College, Davidson, NC 28036