This web page was produced as an assignment for an undergraduate course at Davidson College
My Favorite Yeast Expression: RGT2 and YDL133W
Introduction:
DNA microarrays can be used to determine the expression of genes in any annotated genome. It in this web page I will use DNA microarray expression data to determine the expression pattern for my annotated and unannotated genes from the S. Cerevisiae genome. For more information about the annotated and unannotated genes discussed on this page, please visit my previous page here.
The following scale is used to measure fold repression or induction for all of the microarray data (from Expression Connection)

RGT2:
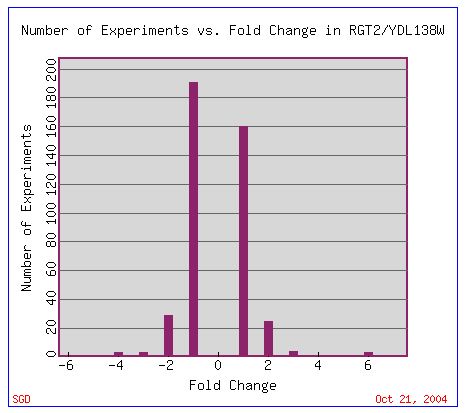
Figure 1: This graph shows the fold change of expression vs. the number of experiments in which the fold change occured. A negative number indicates repression and a positive number indicates induction. This graph was obtained from Expression Connection.
Using the graph above I selected a few microarray experiments in which there was a large fold repression or induction of RGT2. These results can be found in the figures below.
 Figure 2: This image shows the expression data for RGT2 under several different evironmental conditions. This microarray data set included the most highly induced spots for RGT2. The spots were induced six fold suggesting that RGT2 serves an important function under the specific enviromental conditions in which it was induced. This is just a partial view of the microarray data. A more detailed view that includes all of the environmental conditions can be found here.
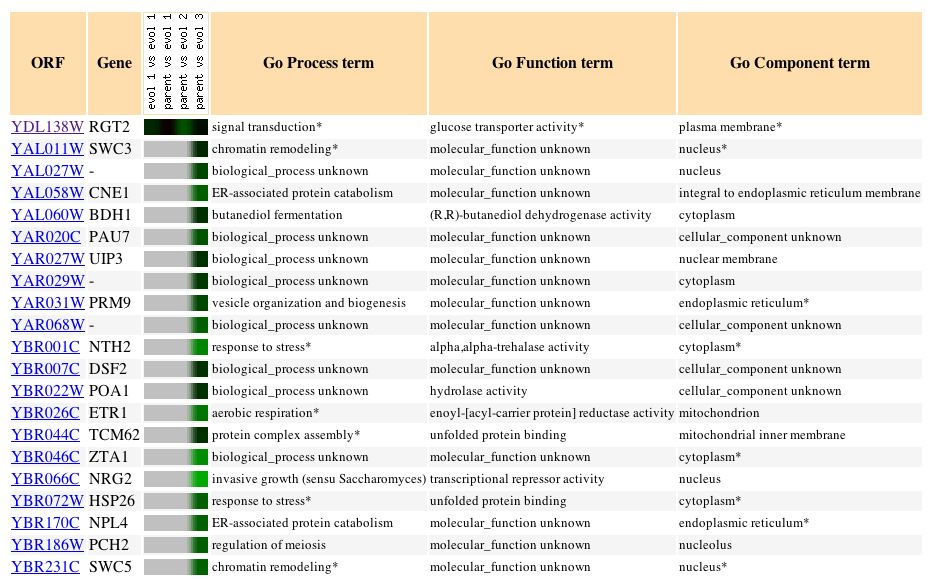
Figure 3: This image shows the expression data for RGT2 in resopose to glucose limitation and its 20 most similar genes with a Pearson correlation of > 0.8 to RGT2. It can be seen from this image that when glucose is limited, RGT2 is repressed. These data support the fact that RGT2 is involved in glucose transporter activity. When there is a lack of glucose present there will be less glucose transport needed, thus the genes invovled in glucose transport will be repressed. Image obtained from Expression Connection.
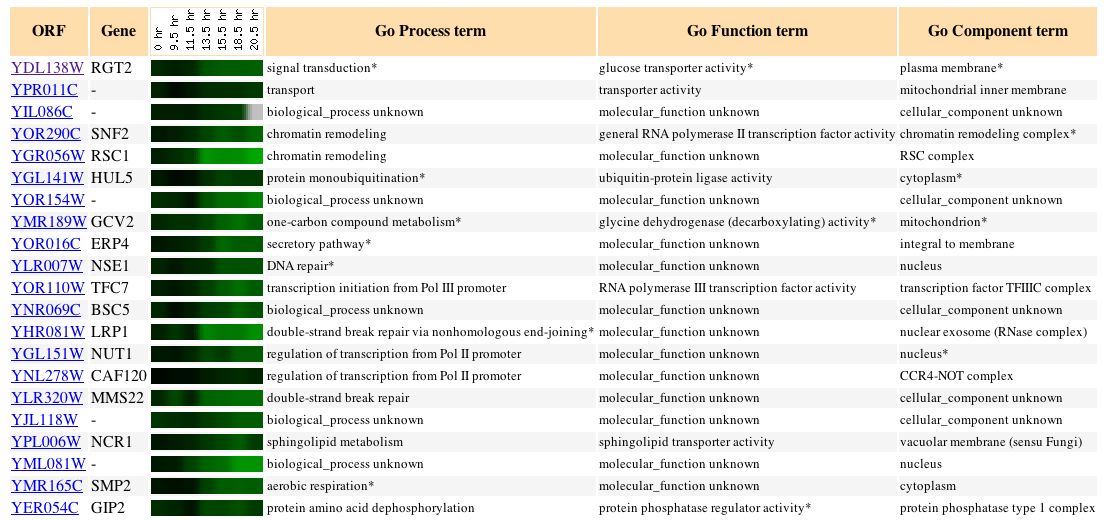
Figure 4: This image shows the expression data for RGT2 in reponse to the diauxic shift and it 20 most similar genes with a Pearson correlation of > 0.8 to RGT2. It can be seen from this image that during the diauxic shift, RGT2 becomes more and more repressed. These data also support the fact that RGT2 is involved in glucose transporter activity. As with the glucose limitation study, the less glucose that is available to the cell, the less glucose transport will be needed. Thus, RGT2 will be repressed because it is not needed by the cell. It is interesting to note that the next closest gene to RGT2, YPR011C, is also involved in transport and transporter activity. Although it does not specify glucose transport, by the guilt by association method, it may be inferred that like RGT2, YPR011C is also involved in some sort of glucose transport. This image obtained from Expression Connection.
Conclusions:
All of the above data support the original conclusions from the previous web assignment. RGT2 is involed in signal tranduction and functions as a glucose transporter.
YDL133W:
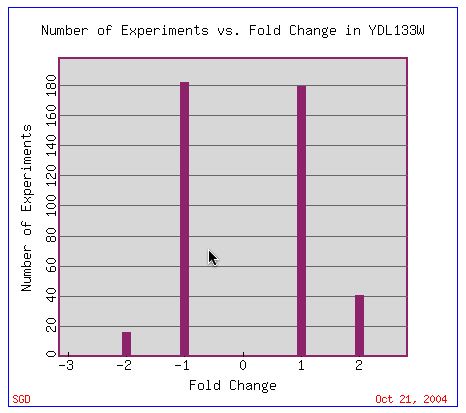
Figure 5: This graph shows the fold change of expression vs. the number of experiments in which the fold change occured. A negative number indicates repression and a positive number indicates induction. This graph was obtained from Expression Connection.
Using the graph above, I picked several microarry expriments in which useful information about YDL133W could be found. The results of these microarray data can be found below.
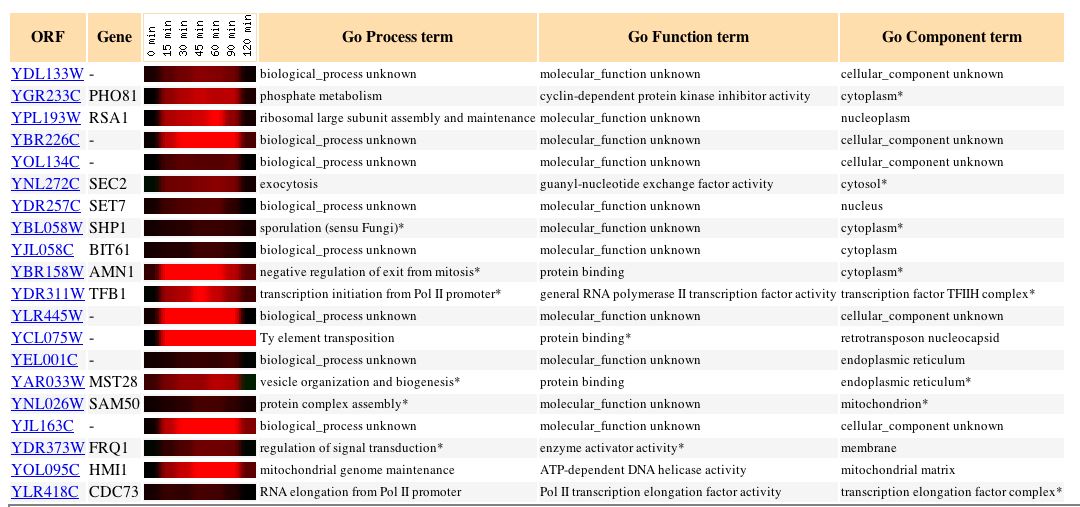
Figure 6:
This image shows the expression data for YDL133W in response to alpha-factor over time. The 20 most similar genes with a Pearson correlation of > 0.8 to YDL133W are also shown. As can be seen from this image YDL133W is induced during time points 15 min - 90 min. It can also be seen that YDL133W has a similar expression pattern to PHO81. It may be possible to link these two genes by the guilt by association method but further expression profiles will be needed before a conclusion can be made. The image was obtained from Epxression Connection.
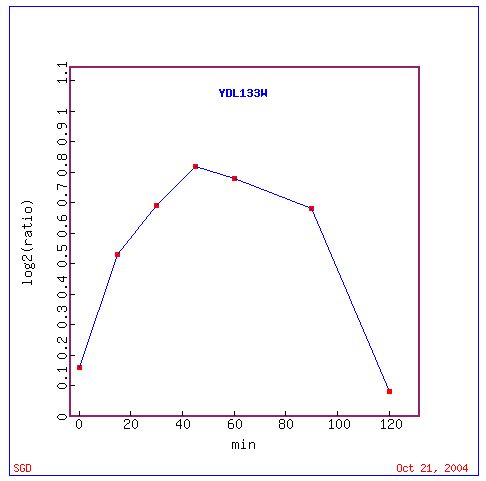
Figure 7: This is an image of the expression of YDL133W over time in response to alpha-factor. It can be noted from this graph that YDL133W is always induced in response to alpha-factor. Graph obtained from Expression Connection.
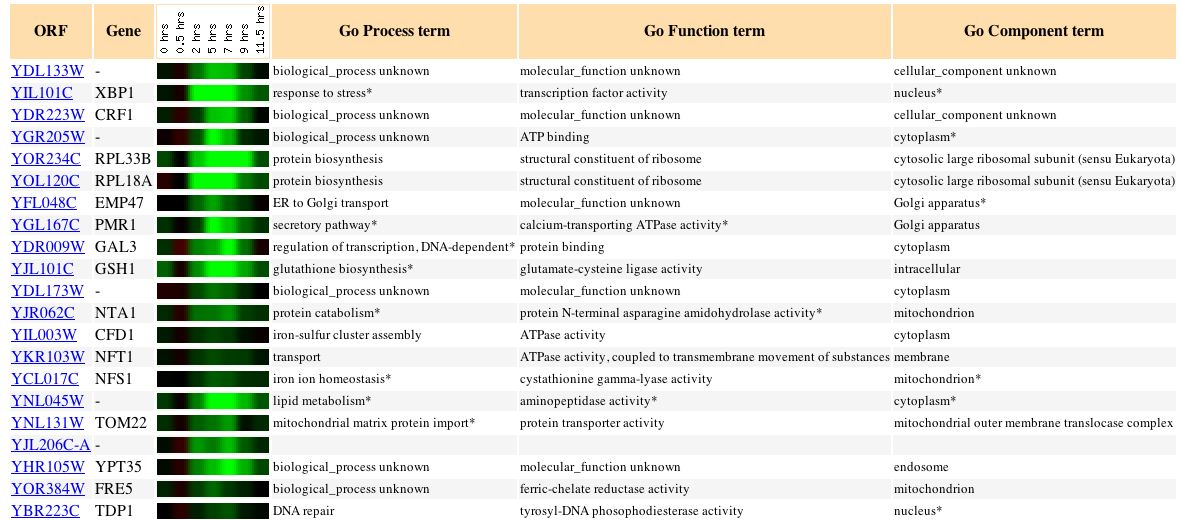
Figure 8: This image shows the expression profile of YDL133W in response to sporulation. The 20 most similar genes with a Pearson correlation of > 0.8 to YDL133W are also shown. It can be seen from this image that YDL133W is repressed in response to sporulation. It can also be seen that YDL133W has an expression profile very similar to that of XBP1 which is involved in the cellular response to stress and functions in transcription factor activity. Image obtained from Expression Connection.
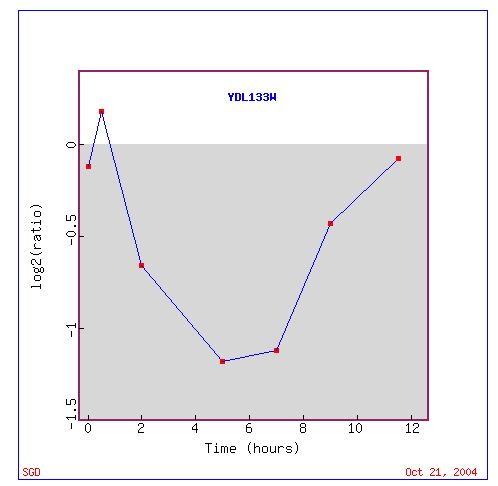
Figure 9: This graph shows the expression pattern of YDL133W to sporulation. It is just another way to look at the expression data portrayed in Figure 8. Graph obtained from Expression Connection.
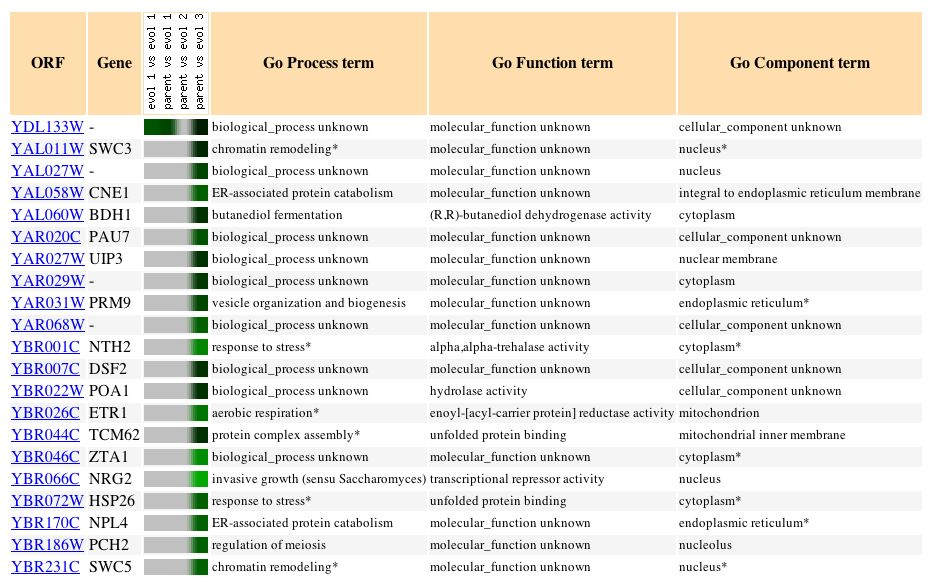
Figure 10: This image shows the expression profile of YDL133W in response to glucose limitation. The 20 most similar genes with a Pearson correlation of > 0.8 to YDL133W are also shown. It can be seen from the figure that YDL133W is always repressed in response to glucose limitation suggesting that it may play a role with glucose metabolism or transport. It may also play a role in fermentation since it is associated with BDH1 which is involved in butanediol fermentation. If YDL133W is involved with glucose metablism or transport, one would expect that in a study in which glucose was present in higher concentrations that it would be induced. Image obtained from Expression Connection.
Cullular Role of YDL133W:
After examining the data obtained from Expression Connection I still could not find an indication of a clear cellular role for YDL133W. As such, I searched Function Junction in order to find out if any new information could be found there. The results of my search can be found below.
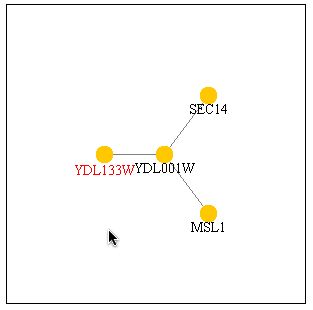
Figure 11: This dendrogram shows that YDL133W interacts with YDL001W which in turn interacts with both SEC14 and MSL1. This image was obtained from PathCalling.
A search of SGD of YDL001W returned the following results:
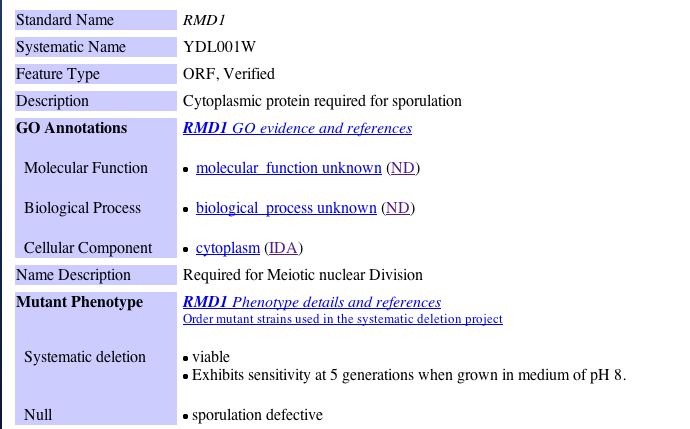
Figure 12: SGD search of YDL001W. As can be seen in the image, YDL001W is required for sporulation. Image obtained from SGD.
Since the SGD database described the protein as being required for sporulation, I checked Expression Connection to determine if the expression pattern under sporulation for YDL001W was similar to that of YDL133W since they interact according to PathCalling. The results of the Expression Connection search are below.

Figure 13: Expression profile of YDL001W in response to sporulation. The 20 most similar genes with a Pearson correlation of > 0.8 to YDL001W are also shown. It can be seen from this figure that the expression profile of YDL001W is not similar to that or YDL133W (Figure 8 above). This suggests that while the proteins may interact according to PathCalling they do not perform the same function. It seems that when YDL133W is repressed, YDL001W is induced. Image obtained from Expression Connection.
In conclusion, I believe that YDL133W is an integral membrane protein that may function in response to sporulation or other cellular stresses. The information contained in Expression Connection and Function Junction shed some light on how the gene is expressed under certain conditions but there is still no clear cellular function that I can determine.
References:
DNA Microarray Flash Animation. 2004. <http://occawlonline.pearsoned.com/bookbind/pubbooks/bc_mcampbell_genomics_1/medialib/method/chip/chip.html> Accessed 21 October 2004.
Expression Connection Database. 2004. <http://db.yeastgenome.org/cgi-bin/expression/expressionConnection.pl> Accessed 21 October 2004.
Fuction Junction Databse. 2004. <http://db.yeastgenome.org/cgi-bin/SGD/functionJunction> Accessed 21 October 2004.
Saccharomyces Genome Database. 2004. <http://www.yeastgenome.org/> Accessed 21 October 2004.
Uetz, et al., Nature 403, 623-627 (2000) - PathCalling <http://portal.curagen.com/extpc/com.curagen.portal.servlet.PortalYeastGene?geneIdIn=846> Accessed 21 October 2004.
Back to Homepage
Davidson Department of Biology Homepage
Davidson Genomics
Davidson College
Questions or comments? E-mail me
© Copyright 2004 Department of Biology, Davidson College, Davidson, NC 28035