Data for Fall Semester, 2000

To see some GCAT Student results:
http://genome-www4.stanford.edu/cgi-bin/SMD/search/basicSearch.pl

Select Experiments, Choose Saccharomyces cerevisiae, and GCAT.
Click on Display Data.
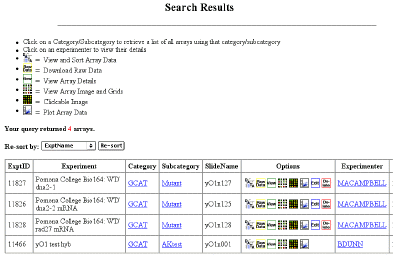
You will see a table of GCAT results.
Click on the icon you want.
Start with the image of the chip with clickable dots.
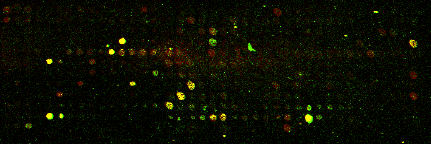
This is part of Laura Hoopes' (Pomona) Bio 164 class data.
Choose a spot and click on it....
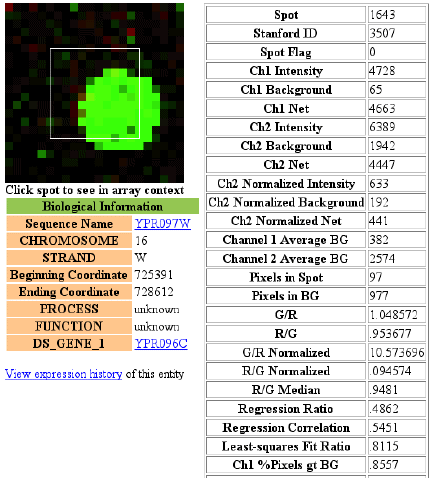
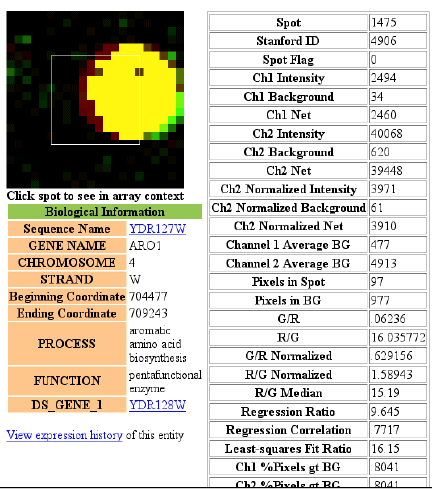
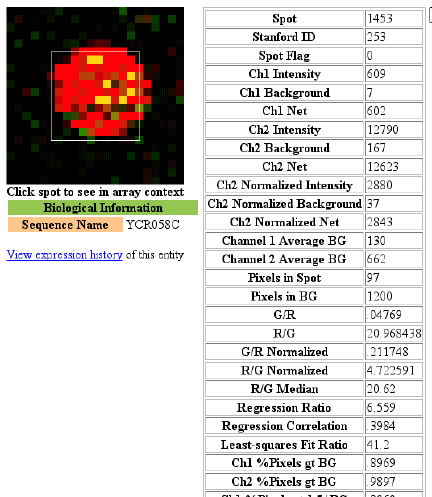
You can find the traffic light range of spots: green, yellow, red.

Or you can compare the gene expression when grown in two different conditions (wt/rad27).