MacDNAsis Analysis of DNA Polymerase
MacDNAsis is a computer program that allows for analysis of several aspects of DNA, RNA, and amino acid sequences. The mRNA from homo sapiens was analyzed using MacDNAsis to determine the molecular weight, number of amino acids, hydropathy, antigenicity, secondary structure, and open reading frames of the delta catalytic subunit of DNA polymerase. Amino acid sequences of the delta catalytic subunit of DNA polymerase found in five different species was also analyzed for homology.

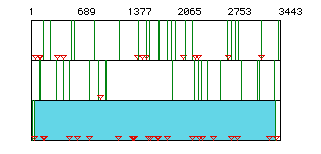
Figure 1. ORF for the delta catalytic subunit of DNA polymerase
from human mRNA. Red triangles indicate start codons, green lines
indicate stop codons. Rows represent each possible open reading frame
(ORF). The blue shading indicates the largest open reading frame
for this molecule, spanning nucleotides 54-3377.
MacDNAsis then translated the largest ORF of human delta catalytic subunit of DNA polymerase into amino acid sequence, producing a sequence of 1108 amino acids with a molecular weight of 123,628.57kDa. .
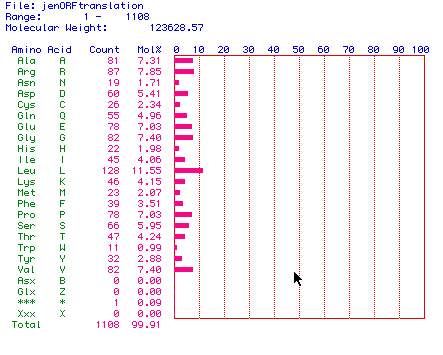
Figure 2. MacDNAsis amino acid translation of human mRNA
from the delta catalytic subunit of DNA polymerase.
Kyte-Doolite Hydropathy Plot:
This plot is used to predict whether the target protein is an integral
membrane protein via hydrophobicity/hydrophilicity charting. Negative
numbers represent hydrophilic regions; positive numbers represent hydrophobic
regions. A value greater than +1.8 suggests possible transmembrane
regions.
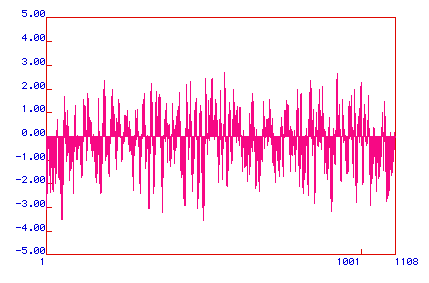
Figure 3. Kyte-Doolittle Hydropathy Plot for the delta catalytic
subunit of DNA polymerase. This subunit probably has several transmembrane
regions.
Hopp and Woods Antigenicity Plot:
This antigenicity plot predicts areas of the protein that may make
good epitope sites, ones characterized by greater hydrophilicity.
Positive numbers represent hydrophilic regions, whereas negative numbers
denote hydrophobic areas.
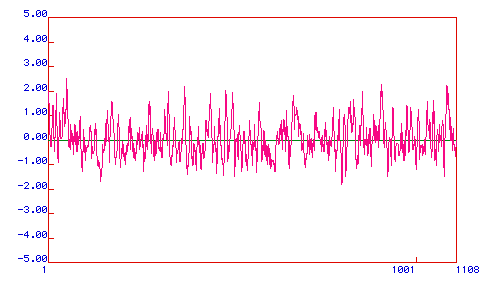
Figure 4. The Hopps and Woods Antigenicity Plot for the delta
catalytic subunit of DNA polymerase indicates several highly hydrophilic
regions. As epitopes are best if antibodies can bind to a linear
sequence with the protein in its native conformation, the most convenient
regions of this subunit would be around amino acids 56-75, 400-425, 904,
and 1098.
The Cho, Fasman, and Rose option allows prediction of the protein's secondary structure. The analysis predicts coils, turns, beta pleated sheets, and alpha helices.
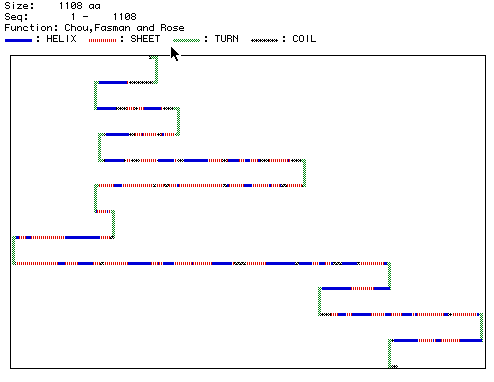
Figure 5. The secondary structure of the delta catalytic subunit
of DNA polymerase. The tertiary structure
of DNA polymerase can be viewed using Chime.
Multiple Sequence Alignment
The structural similarities between human,
hamster,
fly, yeast, and mouse
were analyzed to determine conservation and homology among various species.
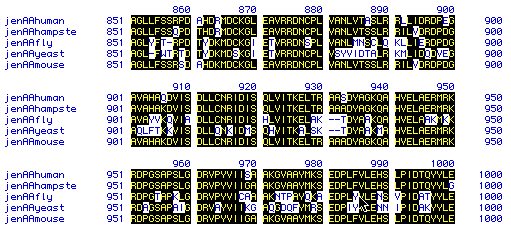
Figure 6. Multiple sequence alignment was performed to determine
conservation and homology among species. Human, hamster, fly, yeast,
and mouse amino acid sequences were used (spaces were inserted to maximize
homology). Black boxes with yellow letters indicate conservation/homology.

Figure 7. Phylogenetic tree for the delta catalytic subunit of
DNA polymerase for hamster,
mouse,
human,
fly,
and yeast. Percentages represent the
degree of homology among amino acid sequences. Strong conservation
can be seen among the mammals, hamster, mouse, and human, with the amino
acid sequences of hamster and mouse DNA polymerase exhibiting 95.1% homology.
Please address correspondence to: jecaldwell@davidson.edu